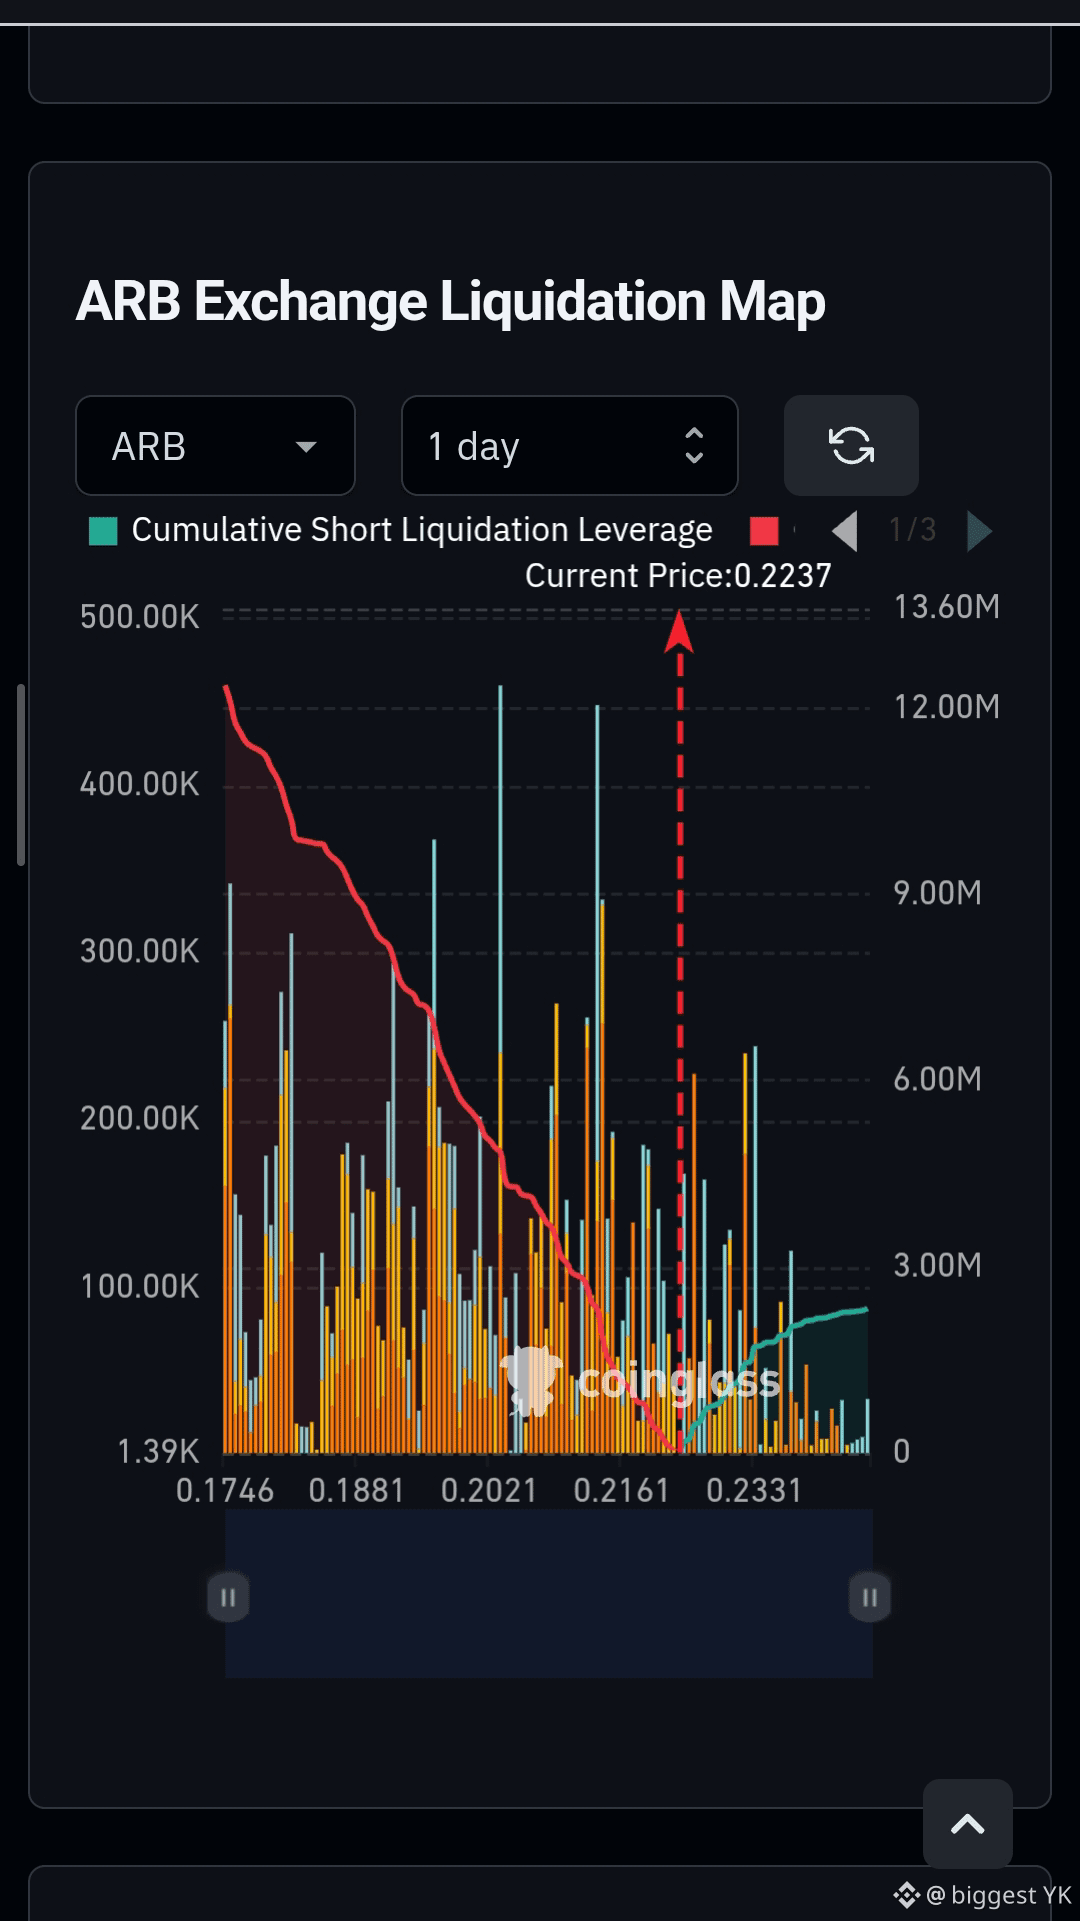
🚨 $ARB HAS OVER $12M OF ESTIMATED LONG LIQUIDATIONS BELOW
CoinGlass’ 1-day liquidation map shows $ARB around $0.2237.
Here’s what stands out:
🔴 Below price: roughly $12M+ in estimated long-liquidation liquidity.
🟢 Above price: roughly $2.5M–$3M in estimated short-liquidation liquidity.
So there is significantly more leveraged long exposure sitting below the current price than short exposure above it.
If ARB drops into those zones, forced long closures could add selling pressure and accelerate the decline.
But if ARB moves higher, short liquidations could fuel the upside instead.
⚠️ These are CoinGlass estimates, not guaranteed liquidation amounts or price targets.
Which side gets swept first? 👀
$ARB
CoinGlass’ 1-day liquidation map shows $ARB around $0.2237.
Here’s what stands out:
🔴 Below price: roughly $12M+ in estimated long-liquidation liquidity.
🟢 Above price: roughly $2.5M–$3M in estimated short-liquidation liquidity.
So there is significantly more leveraged long exposure sitting below the current price than short exposure above it.
If ARB drops into those zones, forced long closures could add selling pressure and accelerate the decline.
But if ARB moves higher, short liquidations could fuel the upside instead.
⚠️ These are CoinGlass estimates, not guaranteed liquidation amounts or price targets.
Which side gets swept first? 👀
$ARB