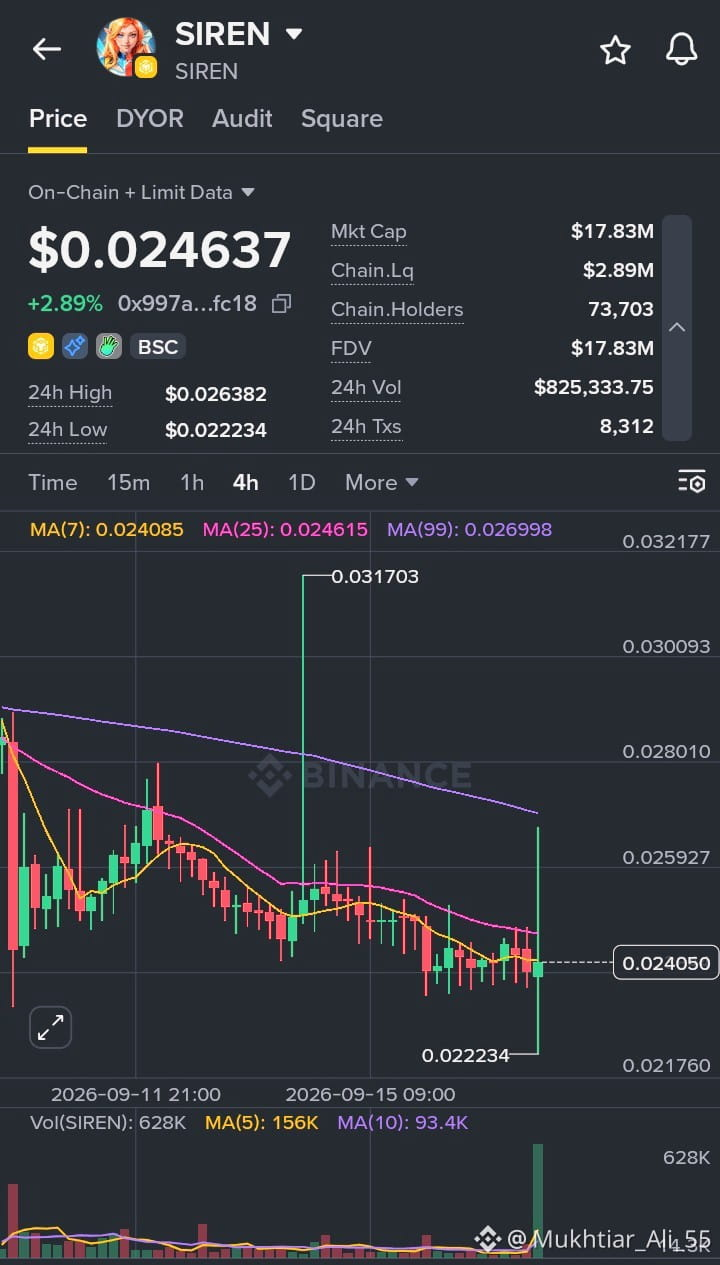
🚀 SIREN ($SIREN ) SHOWING STRENGTH AFTER RECENT LOWS — WHAT THE CHART IS REVEALING 📈🔥
$SIREN | SIREN/USDT
💰 Price: 0.024637
📈 24H Change: +2.89%
📊 24H High: 0.026382
📉 24H Low: 0.022234
💵 24H Volume (USDT): 825,333.75
⚠️ Market Breakdown (4H Timeframe):
SIREN is attempting a steady recovery after finding a firm accumulation base near the recent lows 🧨
🔻 Price bounced steadily from the 0.022234 support zone
📊 Consistent green recovery candles indicate returning buyer demand and a shift in momentum
🧲 A test near the 0.026382 high shows active short-term resistance being challenged
📉 Moving Averages Tell the Story:
📌 MA(7): 0.024085
📌 MA(25): 0.024615
📌 MA(99): 0.026998
❌ Price is working its way back above short-term MAs
❌ Short-term structure turning constructive
❌ Bulls starting to regain control for now 🐻
📊 Volume Insight:
🔴 Noticeable volume activity building up on the upward move
💥 Confirms renewed interest and accumulation phase
⚠️ Volatility remains elevated — watch for confirmation breakout
🧠 What This Means:
This is not a random bounce ❌
This is a trend reversal attempt following a local bottom
🔹 Short-term trend: Bullish
🔹 Momentum: Improving
🔹 Market emotion: Optimistic 📈
🎯 Key Levels to Watch:
🟢 Support: 0.022 – 0.024 zone
🔴 Resistance: 0.026 – 0.029 zone
📌 A clean breakout above 0.0264 is needed for continued upside momentum
📌 Failure to hold 0.0222 could retest deeper support zones ⬇️
💡 Final Take:
🧨 SIREN is navigating a high-potential recovery phase
🧘 Patience > emotions
🛡️ Risk management is critical
Markets reward discipline and strategic planning 💎
#SIREN #CryptoTrading #Altcoins #BinanceSquare #BNBChain
$SIREN
$SIREN | SIREN/USDT
💰 Price: 0.024637
📈 24H Change: +2.89%
📊 24H High: 0.026382
📉 24H Low: 0.022234
💵 24H Volume (USDT): 825,333.75
⚠️ Market Breakdown (4H Timeframe):
SIREN is attempting a steady recovery after finding a firm accumulation base near the recent lows 🧨
🔻 Price bounced steadily from the 0.022234 support zone
📊 Consistent green recovery candles indicate returning buyer demand and a shift in momentum
🧲 A test near the 0.026382 high shows active short-term resistance being challenged
📉 Moving Averages Tell the Story:
📌 MA(7): 0.024085
📌 MA(25): 0.024615
📌 MA(99): 0.026998
❌ Price is working its way back above short-term MAs
❌ Short-term structure turning constructive
❌ Bulls starting to regain control for now 🐻
📊 Volume Insight:
🔴 Noticeable volume activity building up on the upward move
💥 Confirms renewed interest and accumulation phase
⚠️ Volatility remains elevated — watch for confirmation breakout
🧠 What This Means:
This is not a random bounce ❌
This is a trend reversal attempt following a local bottom
🔹 Short-term trend: Bullish
🔹 Momentum: Improving
🔹 Market emotion: Optimistic 📈
🎯 Key Levels to Watch:
🟢 Support: 0.022 – 0.024 zone
🔴 Resistance: 0.026 – 0.029 zone
📌 A clean breakout above 0.0264 is needed for continued upside momentum
📌 Failure to hold 0.0222 could retest deeper support zones ⬇️
💡 Final Take:
🧨 SIREN is navigating a high-potential recovery phase
🧘 Patience > emotions
🛡️ Risk management is critical
Markets reward discipline and strategic planning 💎
#SIREN #CryptoTrading #Altcoins #BinanceSquare #BNBChain
$SIREN