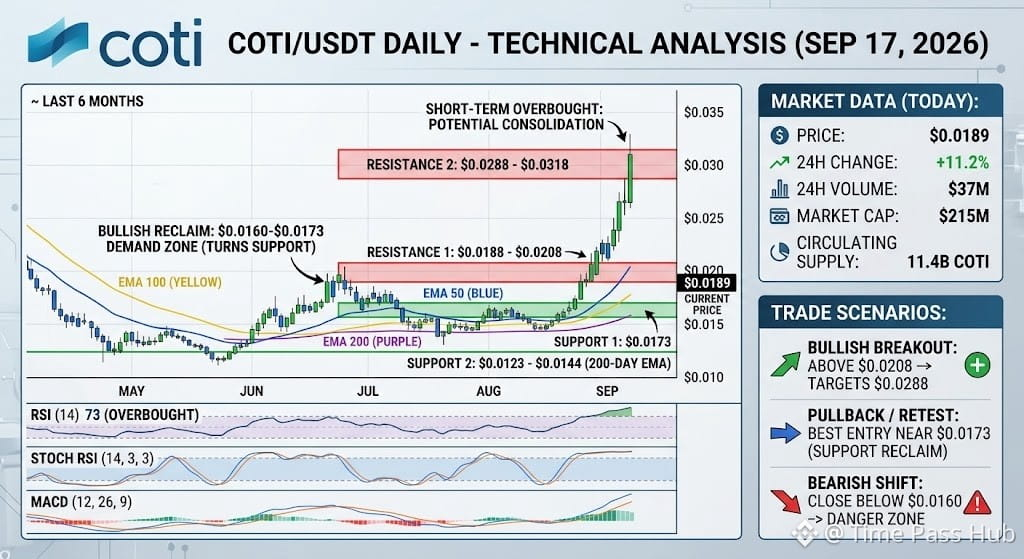
$COTI is currently trading near $0.0184 – $0.0189, seeing a ~4% to 11% daily increase backed by a strong rise in 24-hour volume (~$37M).
Technical Overview
Trend & Structure: The medium-term structure remains constructive as price action holds above key exponential moving averages (EMA 50 and EMA 200). Buyers recently reclaimed the $0.0160 – $0.0173 demand zone, turning it into a immediate floor. $COTI
Momentum: Indicators like RSI (~73) and Stoch RSI suggest short-term momentum is hitting overbought conditions on the daily timeframe. While the MACD confirms bullish momentum, an overextended RSI signals a higher likelihood of short-term consolidation before another push.
Key Levels:
Immediate Support: $0.0166 – $0.0173
Major Support: $0.0123 – $0.0144 (200-day EMA range)
Resistance 1: $0.0188 – $0.0208
Resistance 2: $0.0288 – $0.0318
Trade Scenarios
Bullish Breakout: A daily candle close above $0.0208 opens up liquidity toward $0.0288.
Pullback / Retest: Given overbought momentum, a healthy retest toward $0.0173 offers a higher-probability accumulation zone for long setups with tight invalidation below $0.0160.
Bearish Shift: Losing the $0.0160 support floor invalidates the short-term bullish structure and risks a drift back toward the 200-day EMA near $0.0144. #Coti $COTI
Technical Overview
Trend & Structure: The medium-term structure remains constructive as price action holds above key exponential moving averages (EMA 50 and EMA 200). Buyers recently reclaimed the $0.0160 – $0.0173 demand zone, turning it into a immediate floor. $COTI
Momentum: Indicators like RSI (~73) and Stoch RSI suggest short-term momentum is hitting overbought conditions on the daily timeframe. While the MACD confirms bullish momentum, an overextended RSI signals a higher likelihood of short-term consolidation before another push.
Key Levels:
Immediate Support: $0.0166 – $0.0173
Major Support: $0.0123 – $0.0144 (200-day EMA range)
Resistance 1: $0.0188 – $0.0208
Resistance 2: $0.0288 – $0.0318
Trade Scenarios
Bullish Breakout: A daily candle close above $0.0208 opens up liquidity toward $0.0288.
Pullback / Retest: Given overbought momentum, a healthy retest toward $0.0173 offers a higher-probability accumulation zone for long setups with tight invalidation below $0.0160.
Bearish Shift: Losing the $0.0160 support floor invalidates the short-term bullish structure and risks a drift back toward the 200-day EMA near $0.0144. #Coti $COTI