$ZEC Is Doing Exactly What the Chart Was Hinting At! - What is Next for #ZEC before Trading?
Two days ago, I pointed out that ZEC was building momentum for another bullish move. Now we have the move.
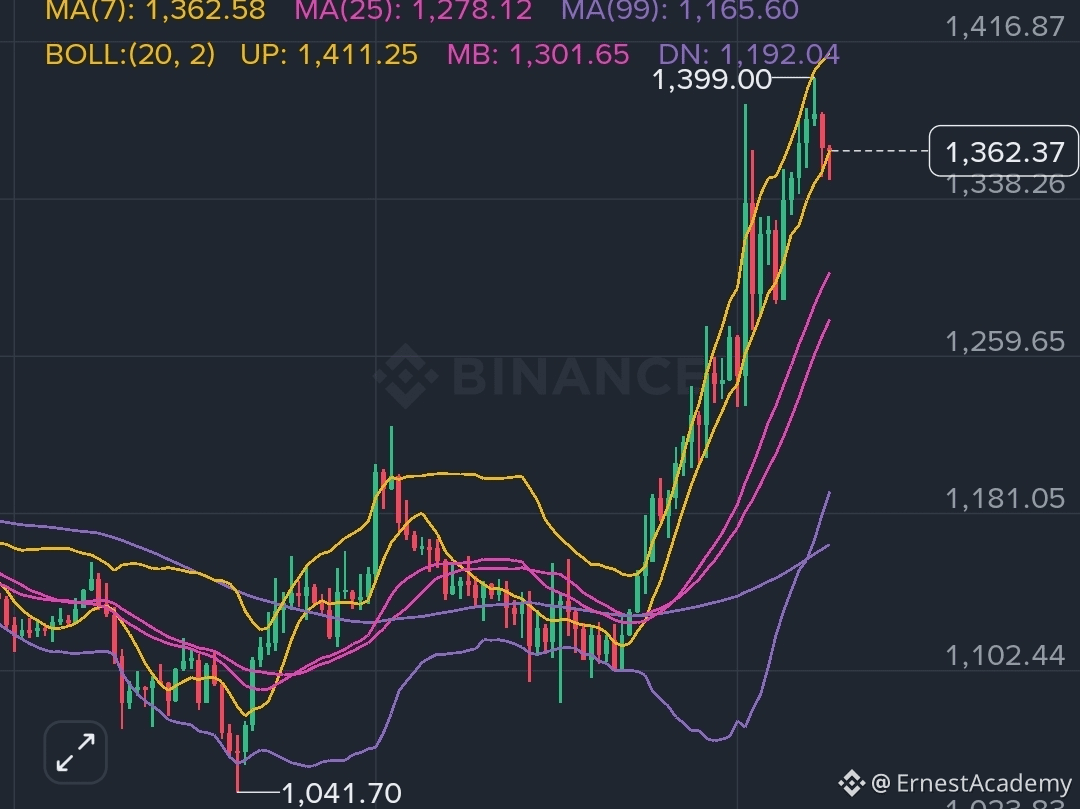
ZEC has pushed to a new all time high of $1,399, with price currently around $1,362 and up more than 18 percent on the day. Recent market data also confirms the strong breakout, with ZEC reaching $1,399
Looking at the 1 hour chart, the structure is clearly bullish. Price is holding above the recent breakout area and remains above the key moving averages shown on the chart. The move from around $1,040 to nearly $1,400 has been aggressive, so some cooling off would not be surprising.
What I like here is that the momentum did not disappear after the first push. Buyers kept stepping in and eventually took out the previous highs.
But now comes the interesting part;
$ZEC is no longer trying to prove that it can break out. It has already done that.
The question is whether it can hold these new levels and turn the previous resistance into support.
Overall, I would describe the chart as bullish, but with increasing volatility.
The move has already proven that buyers are in control. Now $ZEC needs to prove that the $1,300+ area can become a sustainable base rather than just another stop on a vertical rally.
#ZECUSDT
Two days ago, I pointed out that ZEC was building momentum for another bullish move. Now we have the move.
ZEC has pushed to a new all time high of $1,399, with price currently around $1,362 and up more than 18 percent on the day. Recent market data also confirms the strong breakout, with ZEC reaching $1,399
Looking at the 1 hour chart, the structure is clearly bullish. Price is holding above the recent breakout area and remains above the key moving averages shown on the chart. The move from around $1,040 to nearly $1,400 has been aggressive, so some cooling off would not be surprising.
What I like here is that the momentum did not disappear after the first push. Buyers kept stepping in and eventually took out the previous highs.
But now comes the interesting part;
$ZEC is no longer trying to prove that it can break out. It has already done that.
The question is whether it can hold these new levels and turn the previous resistance into support.
Overall, I would describe the chart as bullish, but with increasing volatility.
The move has already proven that buyers are in control. Now $ZEC needs to prove that the $1,300+ area can become a sustainable base rather than just another stop on a vertical rally.
#ZECUSDT