🐻 $SIREN /USDT — The Bounce May Be Running Out of Fuel
$SIREN /USDT — 🟢 SHORT · Conf 84%
Trade Plan:
🎯 Entry: 0.0248145 – 0.0249055
🛑 SL: 0.0256764
🏹 TP1: 0.0242477
🏹 TP2: 0.0238396
🏹 TP3: 0.0232273
Why this setup?
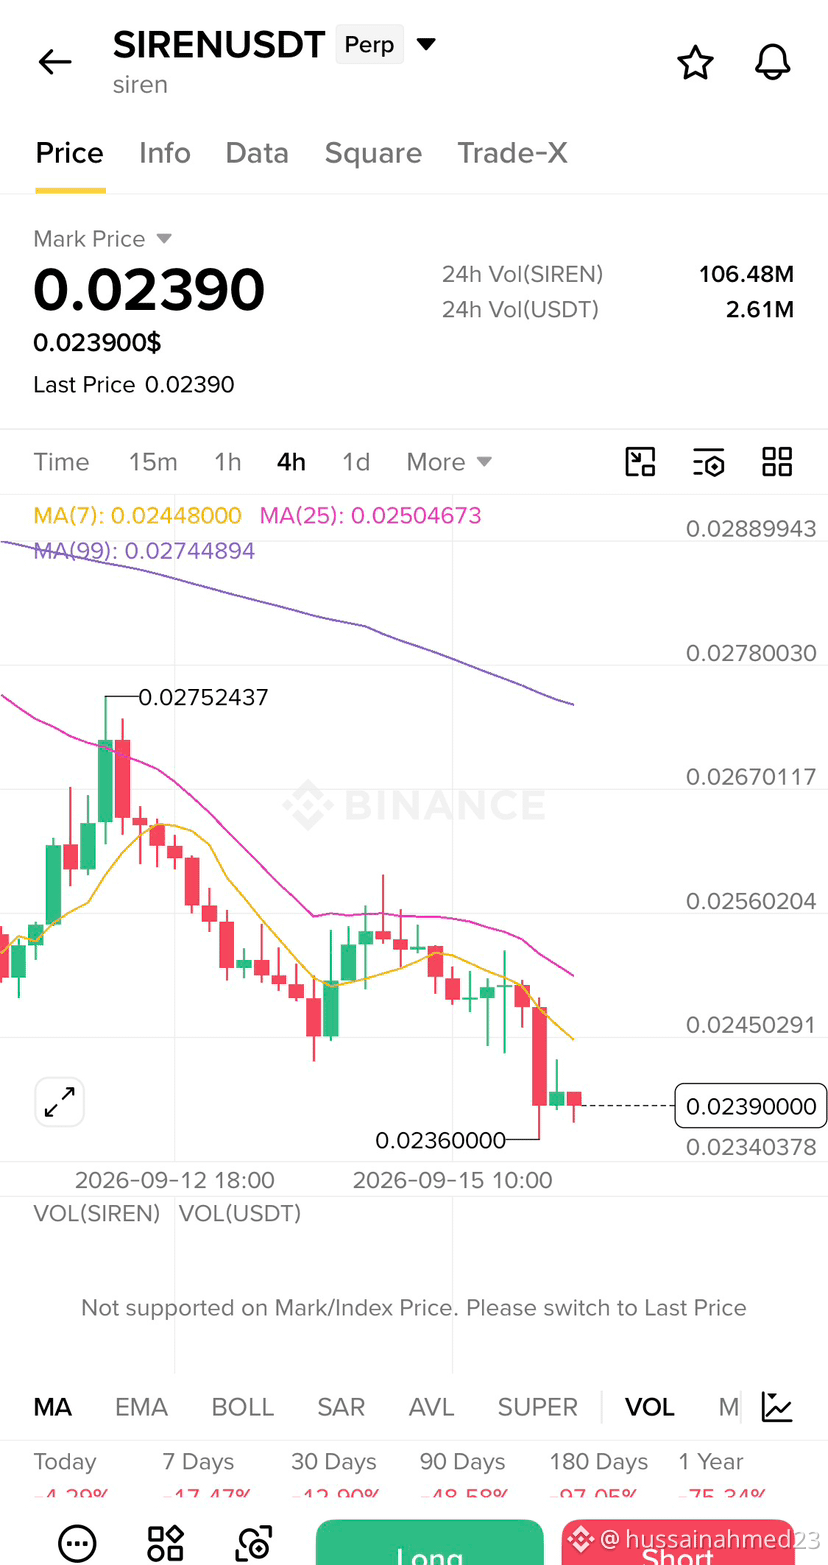
Why now? The 4H chart is showing a clear bearish structure. SIREN is trading around $0.02390, below MA(7) $0.02448, MA(25) $0.02505 and MA(99) $0.02745. The recent rejection from the $0.0275 area has also kept sellers in control.
The broader technical picture remains cautious: recent data shows SIREN trading below key moving averages, with bearish MACD/short-term trend signals, while RSI is not yet deeply oversold.
That makes the $0.02481–$0.02491 zone interesting as a potential retest area. If price rebounds into this zone and sellers step back in, the downside levels are:
TP1: $0.02425
TP2: $0.02384
TP3: $0.02323
The chart’s recent low around $0.02360 is also an important nearby level. A clean break below it could increase downside momentum.
⚠️ However, SIREN is highly volatile, and previous moves have produced sharp squeezes. A strong reclaim above the entry area could invalidate the short idea quickly. Recent market analysis has also documented significant short-squeeze behavior in SIREN, so risk management matters.
🔥 Key Levels
Resistance: 0.02490 → 0.02568 → 0.02745
Support: 0.02360 → 0.02323 → 0.02290
Invalidation: 0.02650 — a sustained move above this level would seriously weaken the bearish thesis.
💬 Debate:
Are we cleanly sliding toward TP2 at $0.02384, or is this another SIREN fakeout before a violent bounce? 👀🔥
Click here to view the chart 👇️
$SIREN /USDT — 🟢 SHORT · Conf 84%
Trade Plan:
🎯 Entry: 0.0248145 – 0.0249055
🛑 SL: 0.0256764
🏹 TP1: 0.0242477
🏹 TP2: 0.0238396
🏹 TP3: 0.0232273
Why this setup?
Why now? The 4H chart is showing a clear bearish structure. SIREN is trading around $0.02390, below MA(7) $0.02448, MA(25) $0.02505 and MA(99) $0.02745. The recent rejection from the $0.0275 area has also kept sellers in control.
The broader technical picture remains cautious: recent data shows SIREN trading below key moving averages, with bearish MACD/short-term trend signals, while RSI is not yet deeply oversold.
That makes the $0.02481–$0.02491 zone interesting as a potential retest area. If price rebounds into this zone and sellers step back in, the downside levels are:
TP1: $0.02425
TP2: $0.02384
TP3: $0.02323
The chart’s recent low around $0.02360 is also an important nearby level. A clean break below it could increase downside momentum.
⚠️ However, SIREN is highly volatile, and previous moves have produced sharp squeezes. A strong reclaim above the entry area could invalidate the short idea quickly. Recent market analysis has also documented significant short-squeeze behavior in SIREN, so risk management matters.
🔥 Key Levels
Resistance: 0.02490 → 0.02568 → 0.02745
Support: 0.02360 → 0.02323 → 0.02290
Invalidation: 0.02650 — a sustained move above this level would seriously weaken the bearish thesis.
💬 Debate:
Are we cleanly sliding toward TP2 at $0.02384, or is this another SIREN fakeout before a violent bounce? 👀🔥
Click here to view the chart 👇️