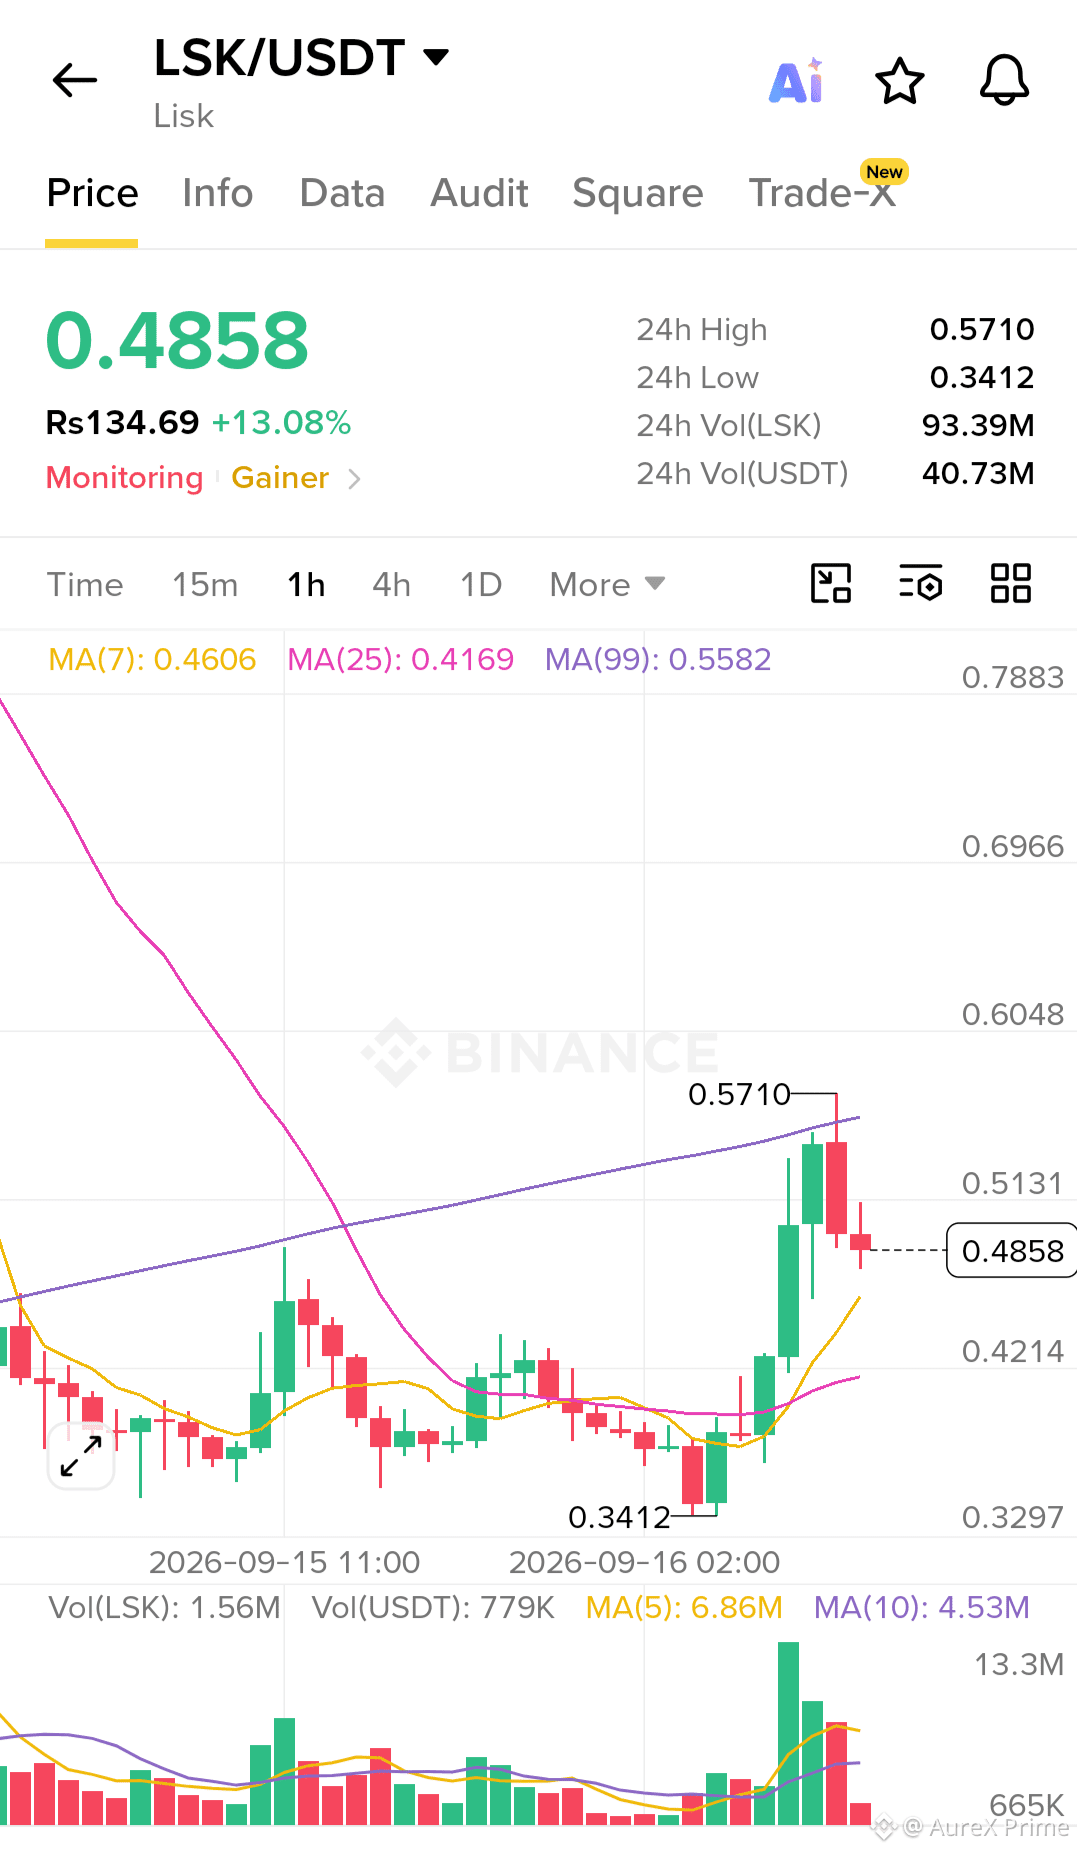
$LSK /USDT is showing strong short-term movement on the 1-hour chart. The current price is 0.4858 USDT, up 13.08%, with a 24-hour high of 0.5710 and low of 0.3412. Price has made a strong recovery from the low, supported by high trading volume, but it has now pulled back from 0.5710, showing some profit-taking. The MA(7) is 0.4606 and MA(25) is 0.4169, both below the current price, supporting the recent upward momentum, while MA(99) is 0.5582, making this area an important resistance zone. Key visible levels are 0.5710 resistance, with 0.5131 as another nearby level, while 0.4606, 0.4214, and 0.3412 are important support areas. Overall, $LSK is currently volatile with strong recent buying activity, but the pullback means price and volume should be watched carefully before making any trading decision.
Conclusion
Overall,$LSK chart shows strong short-term momentum but also high volatility and a clear pullback from 0.5710. Traders should watch price, volume, and the moving averages together. This report is based only on the displayed chart snapshot and is not a prediction or personal financial advice.
Conclusion
Overall,$LSK chart shows strong short-term momentum but also high volatility and a clear pullback from 0.5710. Traders should watch price, volume, and the moving averages together. This report is based only on the displayed chart snapshot and is not a prediction or personal financial advice.