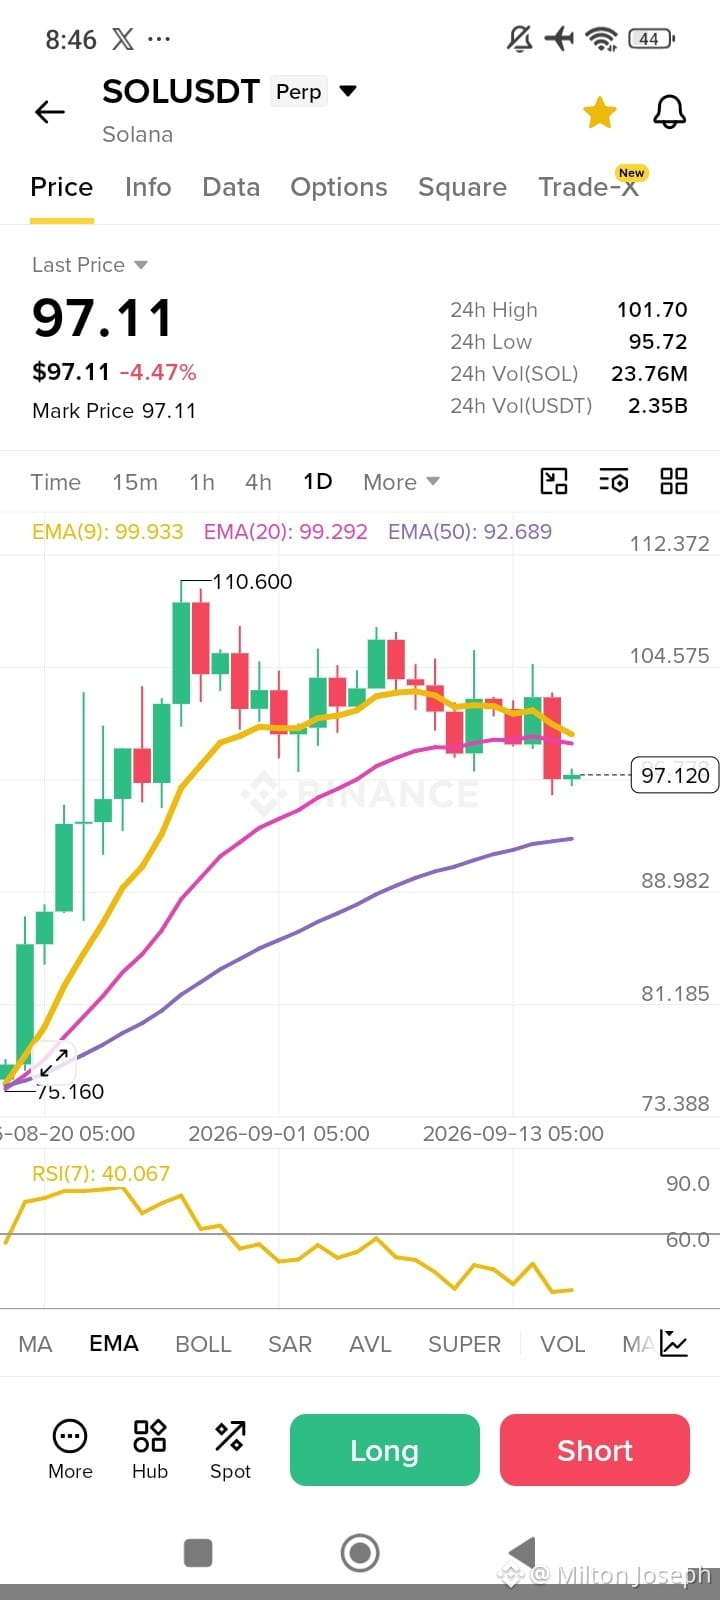
$SOL SOL/USDT (1D Perp) shows short-term bearish pressure breaking below key short-term exponential moving averages.
Current Price & Trend Structure
Current Price: $97.11 (-4.47% daily loss).
EMA Alignment: Price has fallen below both the EMA(9) ($99.93) and EMA(20) ($99.29), signaling a bearish cross on shorter exponential moving averages. The EMA(50) ($92.68) remains sloping upwards below the price, serving as the main macro trendline support.
Price Action: Following a high of $110.60, the price has been forming lower highs and has broken through recent consolidation around $99–$100.
Momentum & Oscillators
RSI(7): Sitting at 40.06, signaling weakening momentum and leaning close to oversold territory, but with room to continue downwards before hitting a strong bounce area.
Key Levels
Immediate Resistance: $99.30 – $100.00 (confluence of EMA 9 & 20 breakout levels).
Next Resistance: $104.50 – $110.60 (recent local highs).
Primary Support: $92.68 (EMA 50 dynamic support level).
Secondary Support: $88.98 – $75.16 (previous major swing lows).
Trading Outlook
Bearish Scenario: If price fails to reclaim $99.30, the path of least resistance points toward retesting dynamic support at the EMA(50) around $92.70.
Bullish Scenario: A daily candle close back above $100.00 would invalidate the short-term breakdown and open up a move back toward $104.50+.
Current Price & Trend Structure
Current Price: $97.11 (-4.47% daily loss).
EMA Alignment: Price has fallen below both the EMA(9) ($99.93) and EMA(20) ($99.29), signaling a bearish cross on shorter exponential moving averages. The EMA(50) ($92.68) remains sloping upwards below the price, serving as the main macro trendline support.
Price Action: Following a high of $110.60, the price has been forming lower highs and has broken through recent consolidation around $99–$100.
Momentum & Oscillators
RSI(7): Sitting at 40.06, signaling weakening momentum and leaning close to oversold territory, but with room to continue downwards before hitting a strong bounce area.
Key Levels
Immediate Resistance: $99.30 – $100.00 (confluence of EMA 9 & 20 breakout levels).
Next Resistance: $104.50 – $110.60 (recent local highs).
Primary Support: $92.68 (EMA 50 dynamic support level).
Secondary Support: $88.98 – $75.16 (previous major swing lows).
Trading Outlook
Bearish Scenario: If price fails to reclaim $99.30, the path of least resistance points toward retesting dynamic support at the EMA(50) around $92.70.
Bullish Scenario: A daily candle close back above $100.00 would invalidate the short-term breakdown and open up a move back toward $104.50+.