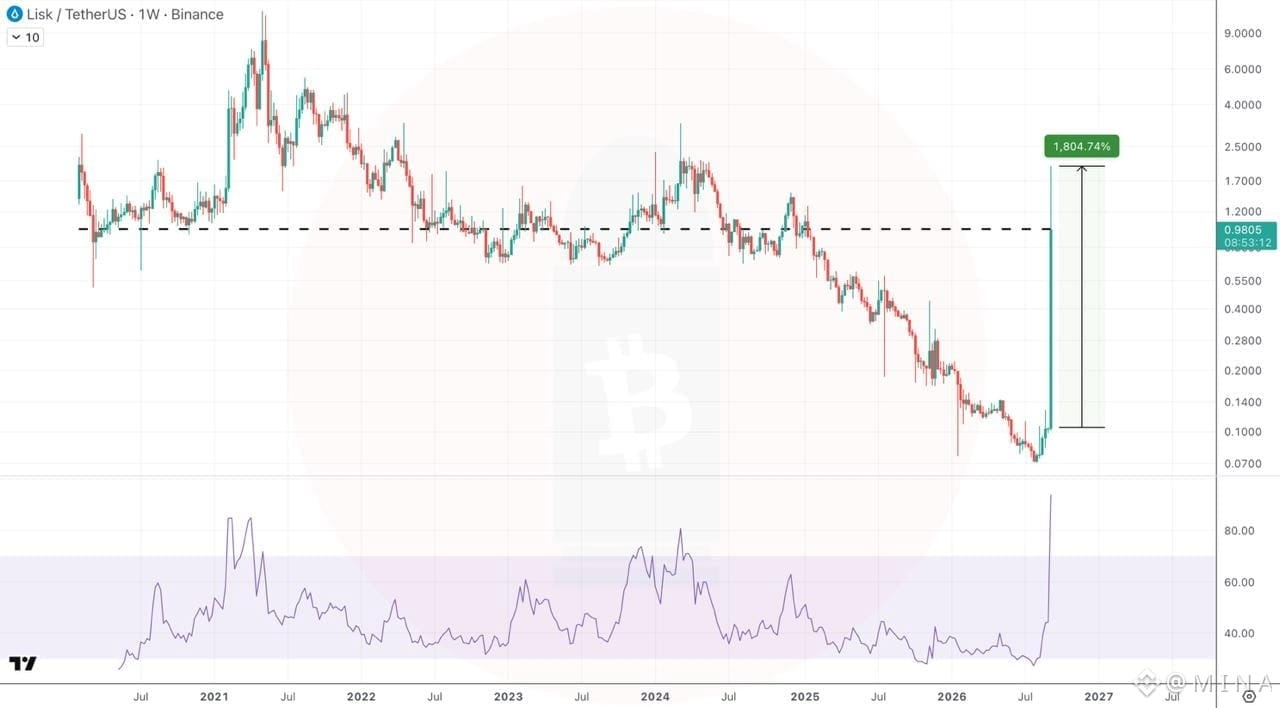
$LSK Weekly Analysis
After nearly 2 years of relentless downtrend, LSK just printed a massive reversal candle up 1,804% off the recent lows in a single week.
Key levels:
• Broke back above the 0.98 horizontal level that acted as support/resistance since 2020
• Momentum indicator spiking to its highest reading on the chart clearly overextended short term
• Move looks parabolic, not gradual accumulation
This is classic V shape reversal on low liquidity behavior. Explosive moves like this after prolonged downtrends often see sharp retracements once early holders start taking profits.
Watching for: whether price can hold above the 0.98 breakout level on a pullback, or if this fades back into the range.
Not financial advice, high volatility, manage risk accordingly.
#lisk #Write2Earn!
After nearly 2 years of relentless downtrend, LSK just printed a massive reversal candle up 1,804% off the recent lows in a single week.
Key levels:
• Broke back above the 0.98 horizontal level that acted as support/resistance since 2020
• Momentum indicator spiking to its highest reading on the chart clearly overextended short term
• Move looks parabolic, not gradual accumulation
This is classic V shape reversal on low liquidity behavior. Explosive moves like this after prolonged downtrends often see sharp retracements once early holders start taking profits.
Watching for: whether price can hold above the 0.98 breakout level on a pullback, or if this fades back into the range.
Not financial advice, high volatility, manage risk accordingly.
#lisk #Write2Earn!