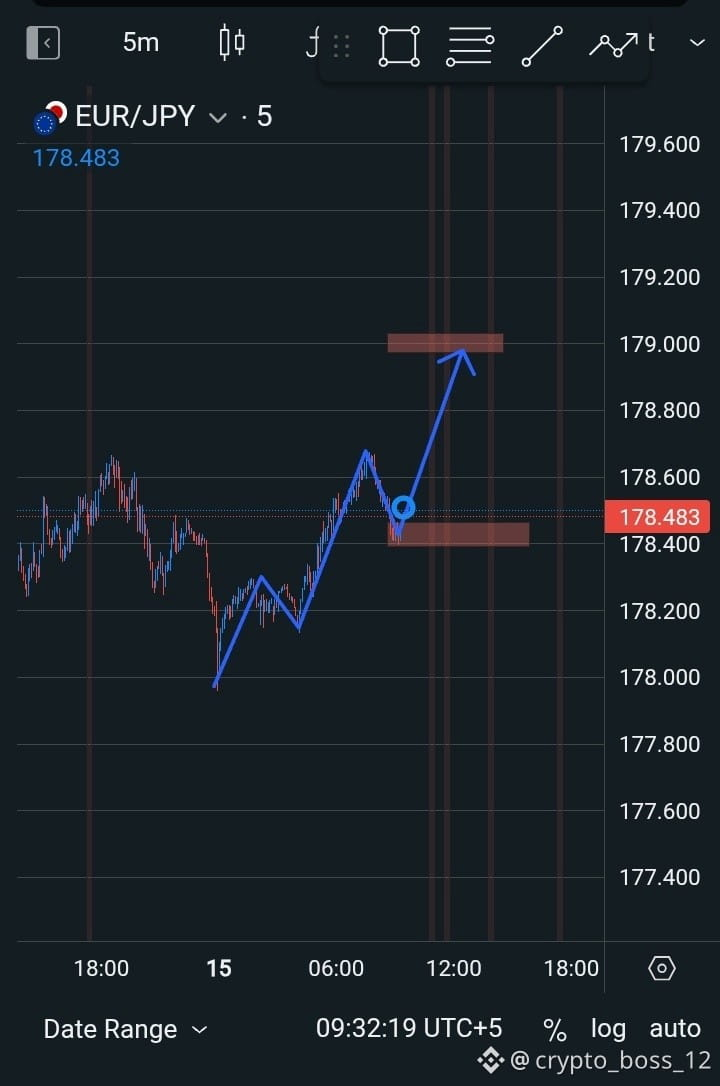
Here is the explanation of the technical analysis shown in the EUR/JPY chart:
Market Overview
Currency Pair & Timeframe: EUR/JPY on a 5-minute (5m) chart.
Pattern: Bullish Trend Continuation / Price Action Pullback Setup.
Key Analysis Components
Market Structure: The blue line highlights a trend reversal from the 178.000 low, forming a Higher High and confirming an upward momentum.
Entry Zone (Demand / Support): After creating a peak near 178.600, the price pulled back into the highlighted reddish box at 178.400 – 178.500. The blue circle indicates the current price (178.483), serving as the Buy entry point.
Target (Take Profit): The top reddish box near 179.000 marks the key resistance zone and serves as the projected Take Profit (TP) target for this trade.
Summary
This analysis represents a classic Pullback Buy Setup. The strategy assumes that after entering at the demand zone, the price will bounce off the support level and move upward toward the 179.000 target.
Market Overview
Currency Pair & Timeframe: EUR/JPY on a 5-minute (5m) chart.
Pattern: Bullish Trend Continuation / Price Action Pullback Setup.
Key Analysis Components
Market Structure: The blue line highlights a trend reversal from the 178.000 low, forming a Higher High and confirming an upward momentum.
Entry Zone (Demand / Support): After creating a peak near 178.600, the price pulled back into the highlighted reddish box at 178.400 – 178.500. The blue circle indicates the current price (178.483), serving as the Buy entry point.
Target (Take Profit): The top reddish box near 179.000 marks the key resistance zone and serves as the projected Take Profit (TP) target for this trade.
Summary
This analysis represents a classic Pullback Buy Setup. The strategy assumes that after entering at the demand zone, the price will bounce off the support level and move upward toward the 179.000 target.