BTCUSDT — 1H Chart Analysis 📊
Current price: 77,914
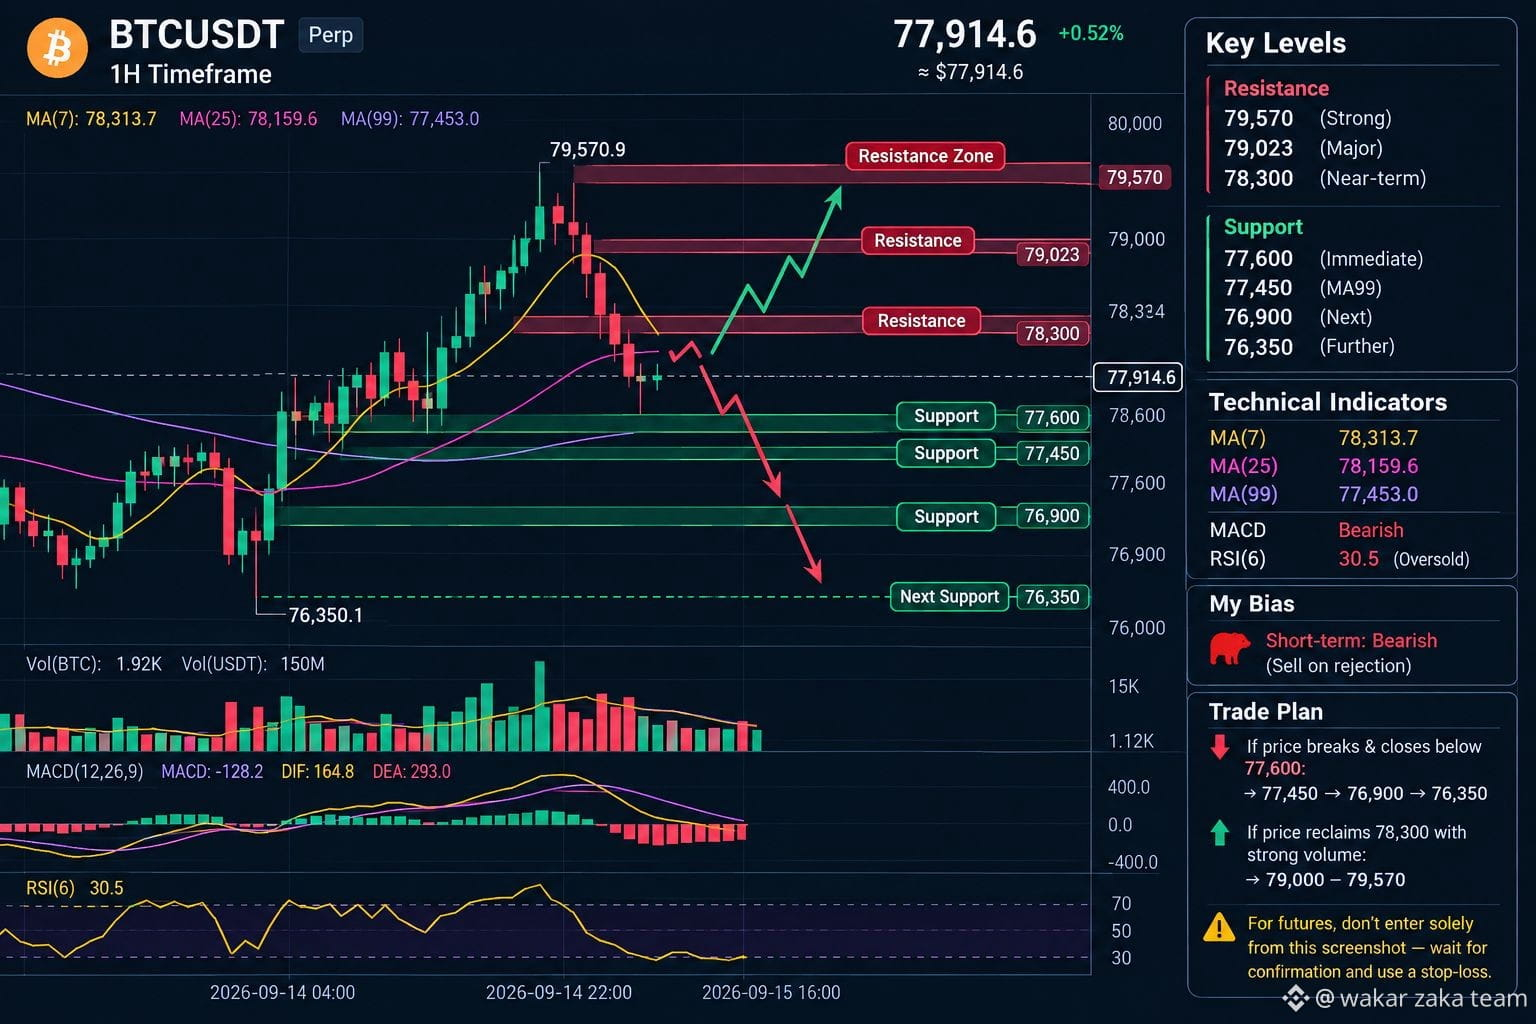
The chart is showing short-term bearish pressure after rejection from 79,570.
🔴 Resistance: 78,300 → 79,023 → 79,570
🟢 Support: 77,600 → 77,450 → 76,900
MA(7): 78,314 — price is below it
MA(25): 78,160 — price is below it
MA(99): 77,453 — important support
MACD: bearish, histogram negative
RSI(6): 30.5 — near oversold, so a short bounce is possible
📉 My bias
Short-term: Bearish / sell on rejection
If BTC breaks and closes below 77,600, the next downside zones could be 77,450 → 76,900 → 76,350.
If price reclaims 78,300 with strong volume, bearish momentum weakens and BTC could retest 79,000–79,570.#
⚠️ For futures, don't enter solely from this screenshot—wait for confirmation and use a stop-loss.
$BTC
$NVDAB
Current price: 77,914
The chart is showing short-term bearish pressure after rejection from 79,570.
🔴 Resistance: 78,300 → 79,023 → 79,570
🟢 Support: 77,600 → 77,450 → 76,900
MA(7): 78,314 — price is below it
MA(25): 78,160 — price is below it
MA(99): 77,453 — important support
MACD: bearish, histogram negative
RSI(6): 30.5 — near oversold, so a short bounce is possible
📉 My bias
Short-term: Bearish / sell on rejection
If BTC breaks and closes below 77,600, the next downside zones could be 77,450 → 76,900 → 76,350.
If price reclaims 78,300 with strong volume, bearish momentum weakens and BTC could retest 79,000–79,570.#
⚠️ For futures, don't enter solely from this screenshot—wait for confirmation and use a stop-loss.
$BTC
$NVDAB