Missing a bearish break on $ETH /USDT while the 1D trend still reads bullish is a trap most traders will ignore.
$ETH - 🔴 SHORT · Conf 54%
Trade Plan:
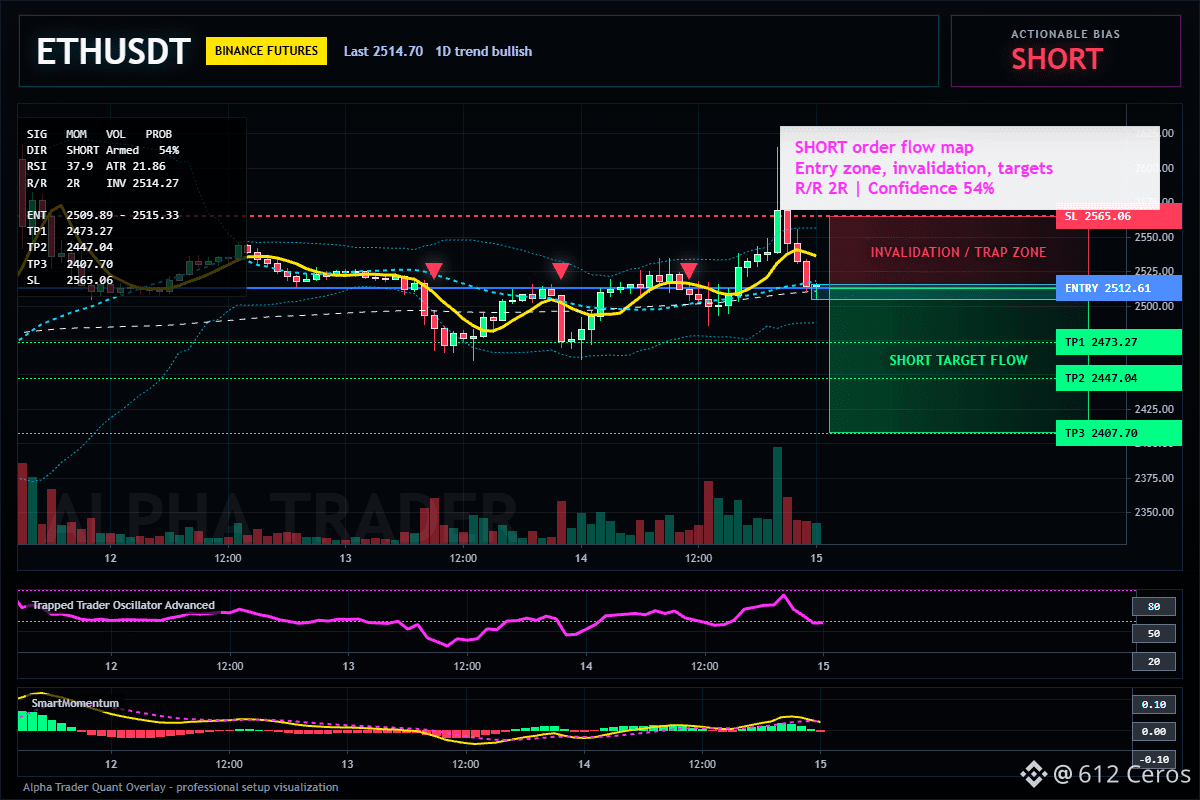
Entry: 2509.89 – 2515.33
SL: 2565.06
TP1: 2473.27
TP2: 2447.04
TP3: 2407.70
Why this setup?
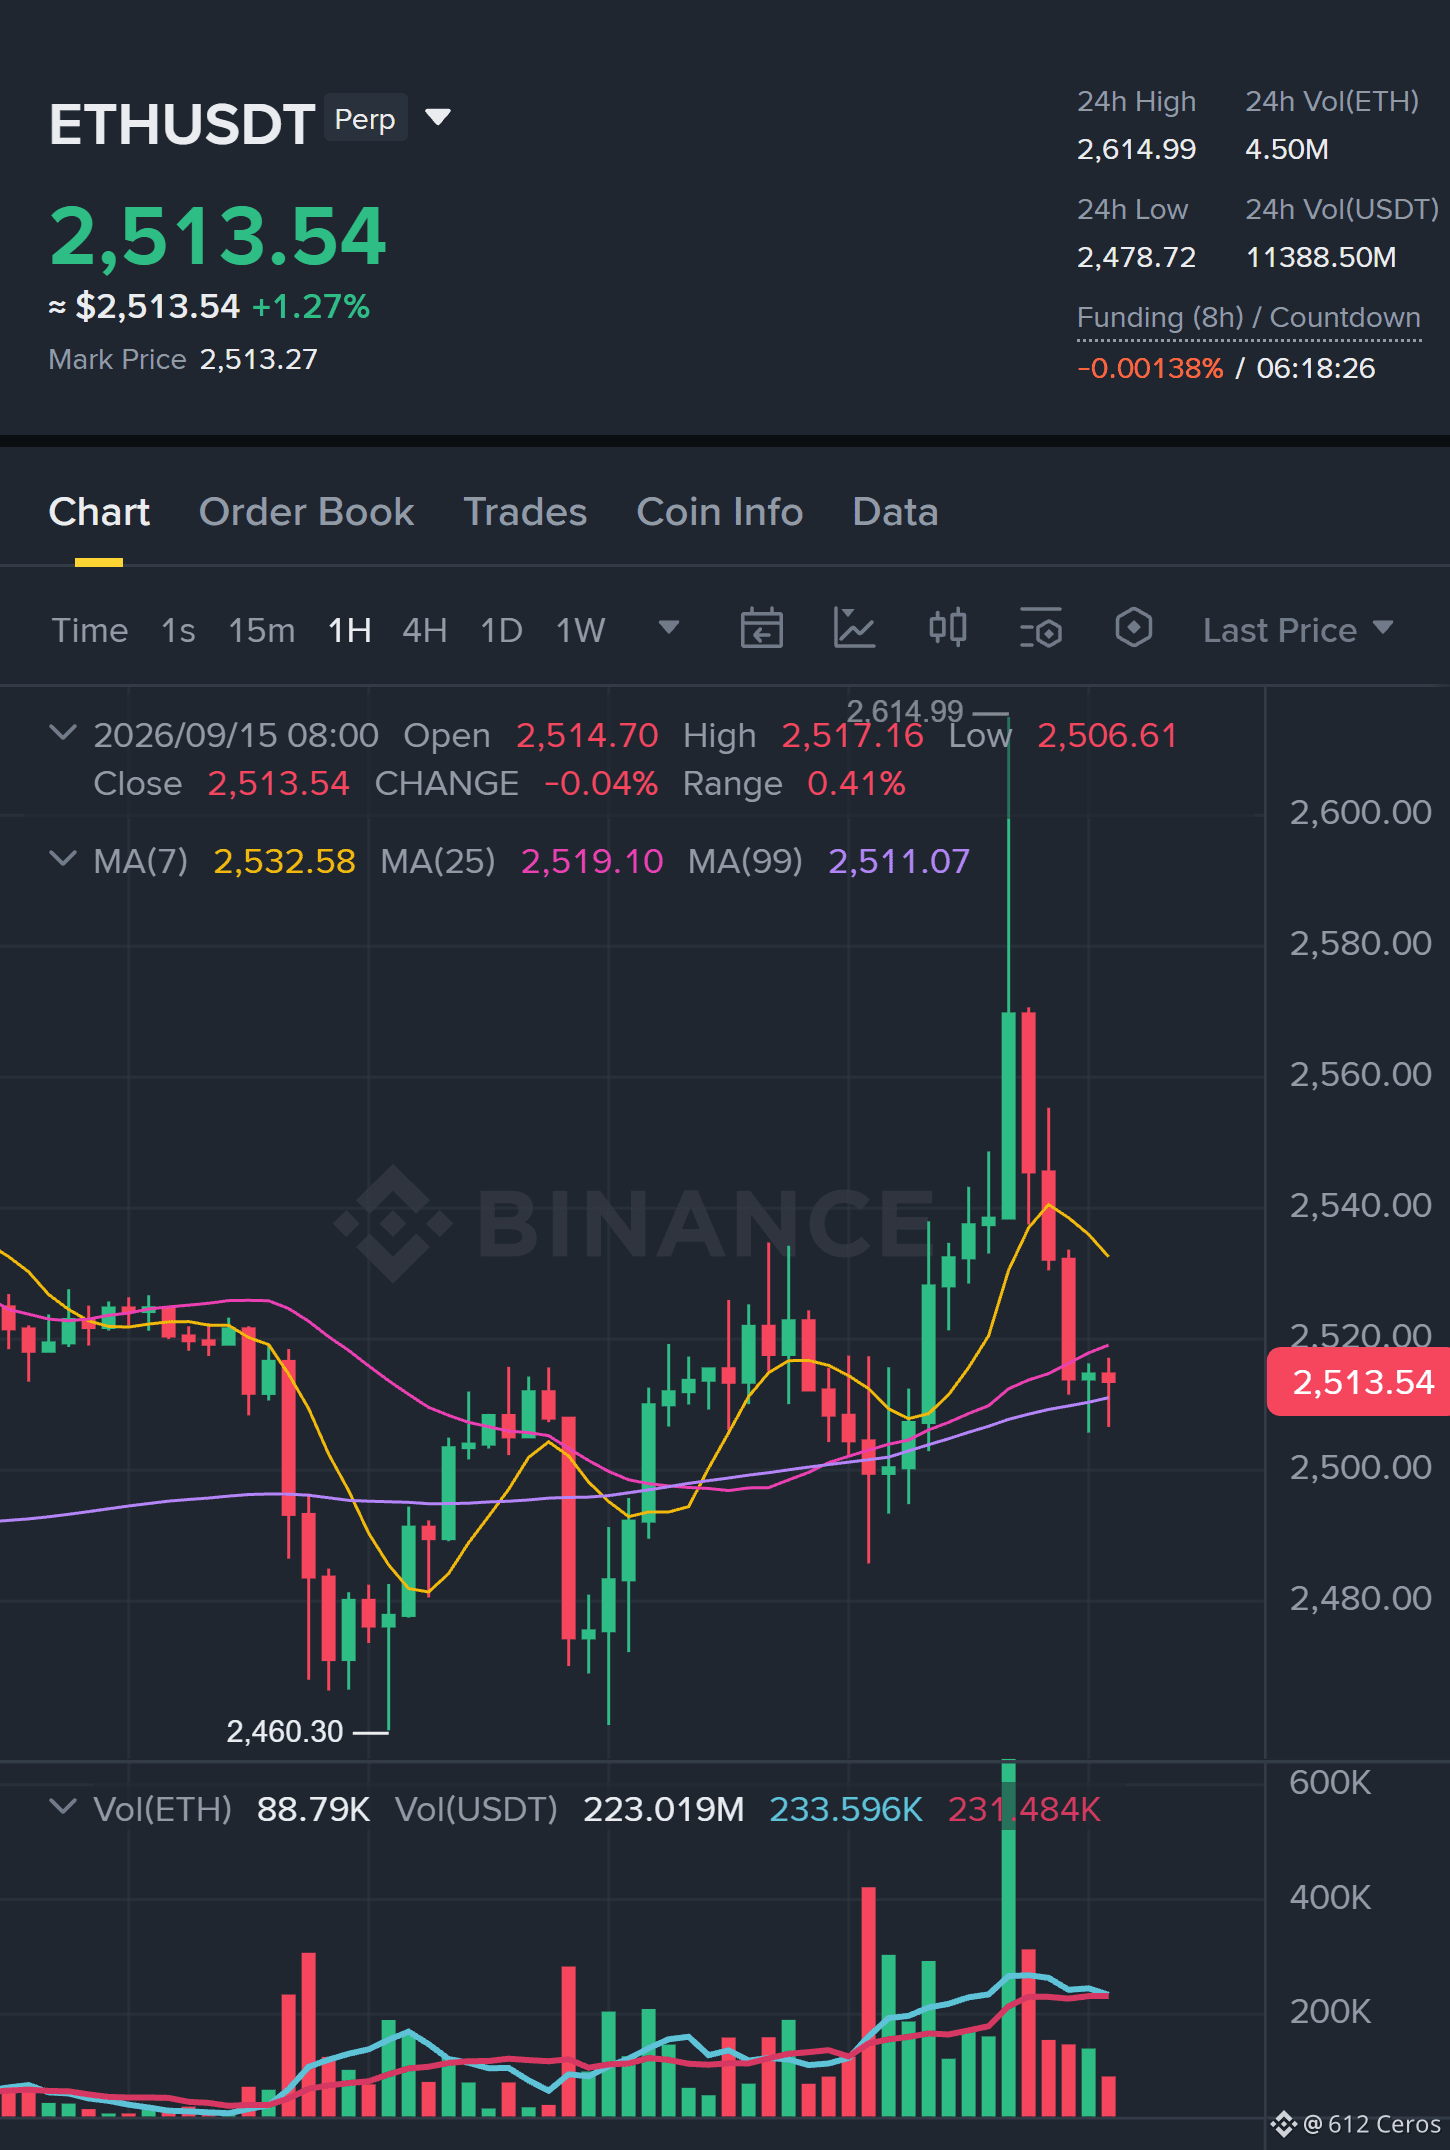
Why now? The daily trend remains bullish, but the 1h price is already sliding from 2512.61 into the short entry zone between 2509.89 and 2515.33, and the 15m RSI at 37.85 confirms momentum is flipping bearish before the 1h ATR of 21.86 can exhaust itself. If the short holds, TP1 lands at 2473.27, TP2 at 2447.04, and TP3 pushes into 2407.70, but the invalidation level at 2514.27 is the hard line that separates a clean reversal from a failed contrarian bet against the higher-timeframe trend. Because this setup fights the 1D bullish bias, it is a counter-trend reversal with higher risk than a trend-following trade, so sizing down and respecting the SL is non-negotiable.
Debate:
Are you seeing the 1h momentum hold long enough to reach TP2, or is the daily bullish trend already pulling this short back into the invalidation zone?
Click here to view the chart 👇️
⚠️ Personal market analysis only. NFA — manage risk and DYOR.
Educational content, not investment advice or a recommendation to buy, sell, deposit, or withdraw any asset. No paid promotion or referral/affiliate links.
$ETH - 🔴 SHORT · Conf 54%
Trade Plan:
Entry: 2509.89 – 2515.33
SL: 2565.06
TP1: 2473.27
TP2: 2447.04
TP3: 2407.70
Why this setup?
Why now? The daily trend remains bullish, but the 1h price is already sliding from 2512.61 into the short entry zone between 2509.89 and 2515.33, and the 15m RSI at 37.85 confirms momentum is flipping bearish before the 1h ATR of 21.86 can exhaust itself. If the short holds, TP1 lands at 2473.27, TP2 at 2447.04, and TP3 pushes into 2407.70, but the invalidation level at 2514.27 is the hard line that separates a clean reversal from a failed contrarian bet against the higher-timeframe trend. Because this setup fights the 1D bullish bias, it is a counter-trend reversal with higher risk than a trend-following trade, so sizing down and respecting the SL is non-negotiable.
Debate:
Are you seeing the 1h momentum hold long enough to reach TP2, or is the daily bullish trend already pulling this short back into the invalidation zone?
Click here to view the chart 👇️
⚠️ Personal market analysis only. NFA — manage risk and DYOR.
Educational content, not investment advice or a recommendation to buy, sell, deposit, or withdraw any asset. No paid promotion or referral/affiliate links.