Can You Read a Crypto Chart? Start Here. 📊
A crypto chart can look complicated when you first open it.
Candles, numbers, lines, timeframes…
But you don’t need to understand everything at once.
Start with these 4 things
1️⃣ Price
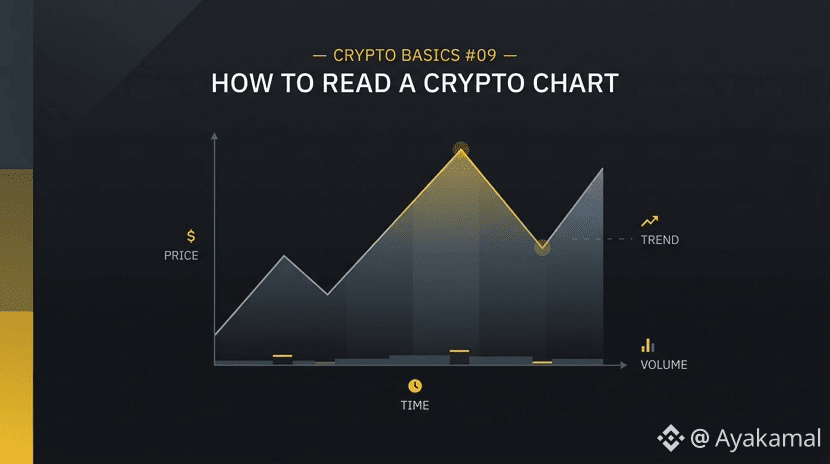
The vertical axis shows the asset’s price.
It tells you how much the asset was trading for at different points in time.
2️⃣ Time
The horizontal axis shows when those price movements happened.
You can view different timeframes, from very short periods to much longer ones.
A shorter timeframe gives you a closer look at short-term movements, while a longer timeframe gives you a broader view.
3️⃣ Trend
Now step back and look at the bigger picture.
📈 Uptrend → price generally moves higher.
📉 Downtrend → price generally moves lower.
↔️ Sideways → price moves within a relatively defined range.
A trend describes what price has been doing — it does not guarantee what happens next.
4️⃣ Volume
Below the price chart, you’ll often see Volume.
It measures the amount of trading activity during a specific period.
Looking at volume alongside price can provide additional context about a market move.
The easiest way to start reading a chart:
Price → Timeframe → Trend → Volume
You don’t need 10 indicators to understand the basics.
Start with the chart itself.
📚 Keep learning with Binance Academy.
Educational content only, not financial advice. DYOR and use official Binance sources.
What was the first thing that confused you when you opened a crypto chart? 👇
#Binance #BinanceAcademy #learnwithbinance #CryptoEducation
A crypto chart can look complicated when you first open it.
Candles, numbers, lines, timeframes…
But you don’t need to understand everything at once.
Start with these 4 things
1️⃣ Price
The vertical axis shows the asset’s price.
It tells you how much the asset was trading for at different points in time.
2️⃣ Time
The horizontal axis shows when those price movements happened.
You can view different timeframes, from very short periods to much longer ones.
A shorter timeframe gives you a closer look at short-term movements, while a longer timeframe gives you a broader view.
3️⃣ Trend
Now step back and look at the bigger picture.
📈 Uptrend → price generally moves higher.
📉 Downtrend → price generally moves lower.
↔️ Sideways → price moves within a relatively defined range.
A trend describes what price has been doing — it does not guarantee what happens next.
4️⃣ Volume
Below the price chart, you’ll often see Volume.
It measures the amount of trading activity during a specific period.
Looking at volume alongside price can provide additional context about a market move.
The easiest way to start reading a chart:
Price → Timeframe → Trend → Volume
You don’t need 10 indicators to understand the basics.
Start with the chart itself.
📚 Keep learning with Binance Academy.
Educational content only, not financial advice. DYOR and use official Binance sources.
What was the first thing that confused you when you opened a crypto chart? 👇
#Binance #BinanceAcademy #learnwithbinance #CryptoEducation