Most traders will ignore this hidden BNB setup hiding in plain sight
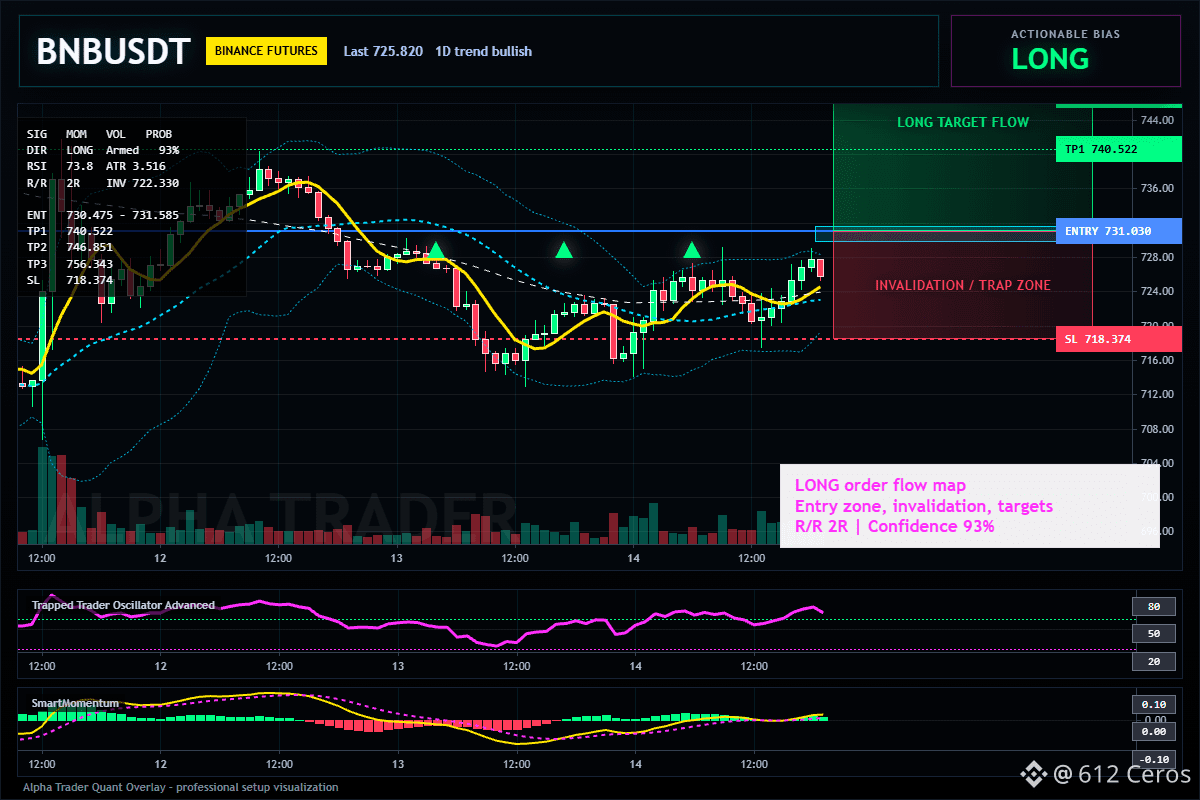
$BNB /USDT - 🟢 LONG · Conf 93%
Trade Plan:
Entry: 730.475 – 731.585
SL: 718.374
TP1: 740.522
TP2: 746.851
TP3: 756.343
Why this setup?
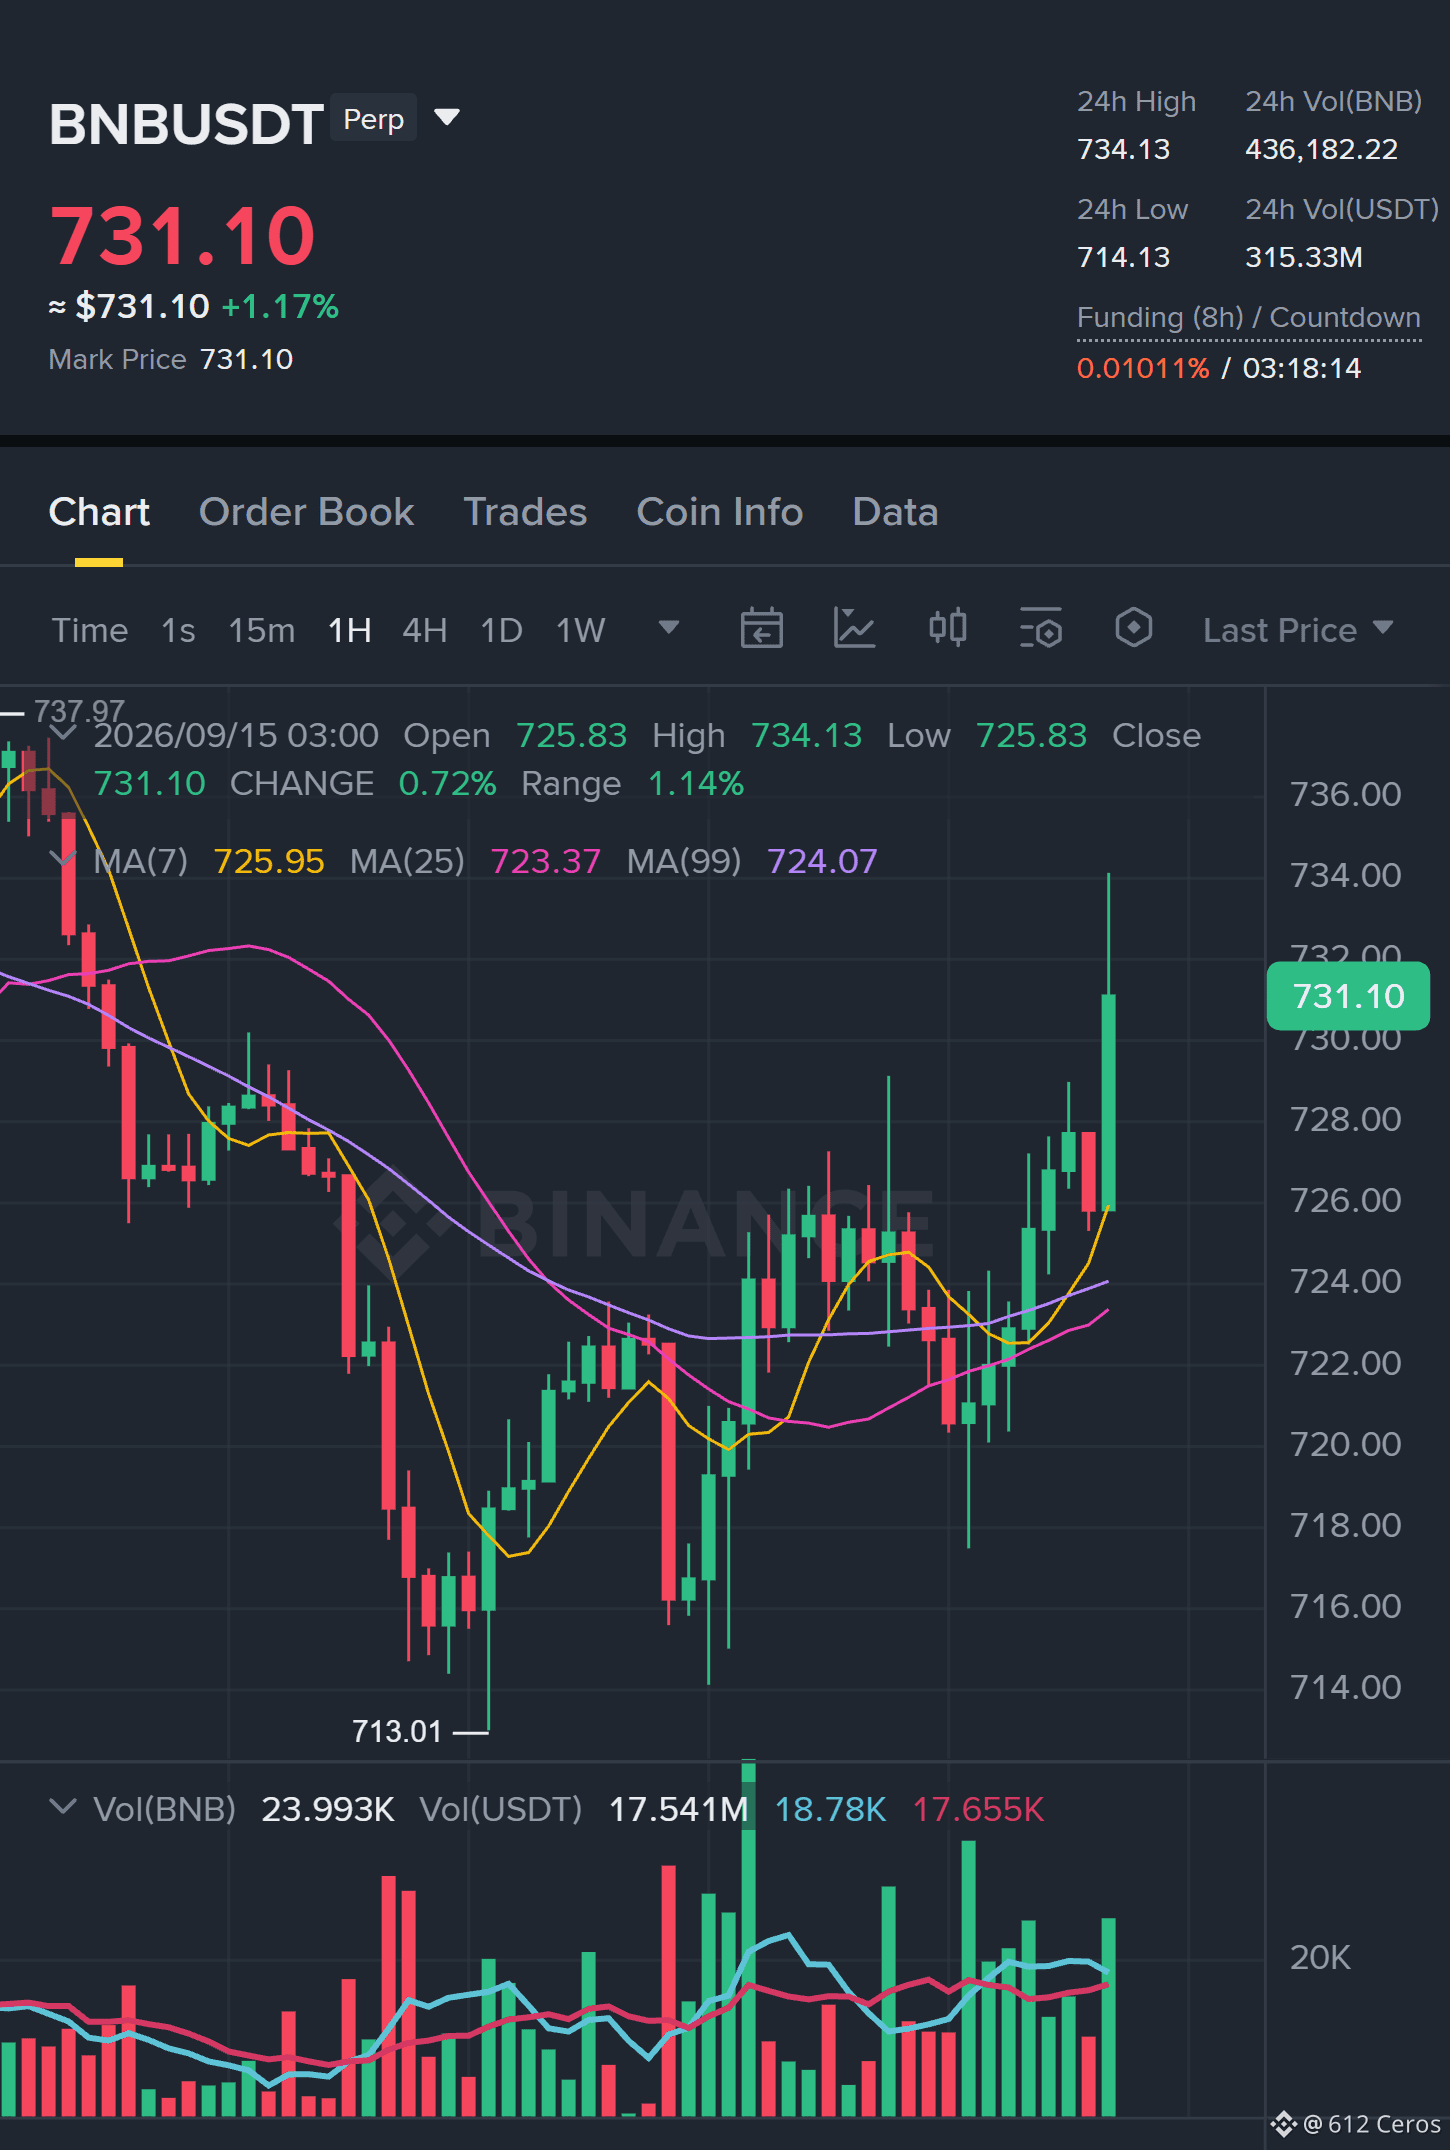
Why now? The daily trend is bullish, but the 1h ATR of 3.516471 shows volatility is compressing just before a potential expansion, and the 15m RSI at 73.84 signals momentum is still climbing without being overextended on this timeframe. The entry zone between 730.475 and 731.585 aligns with the 1h price of 731.030, offering a precise trigger for a long. If price pushes toward TP1 at 740.522 and then TP2 at 746.851, the move targets a measured extension of that volatility. The line in the sand is invalidation at 722.330, where a break would negate the entire structure. This is a trend-following setup, not a counter-trend gamble, so size accordingly and defend the invalidation level ruthlessly.
Debate:
Are you ready to defend the 722.330 invalidation or waiting for a pullback entry?
Click here to view the chart 👇️
⚠️ Personal market analysis only. NFA — manage risk and DYOR.
Educational content, not investment advice or a recommendation to buy, sell, deposit, or withdraw any asset. No paid promotion or referral/affiliate links.
$BNB /USDT - 🟢 LONG · Conf 93%
Trade Plan:
Entry: 730.475 – 731.585
SL: 718.374
TP1: 740.522
TP2: 746.851
TP3: 756.343
Why this setup?
Why now? The daily trend is bullish, but the 1h ATR of 3.516471 shows volatility is compressing just before a potential expansion, and the 15m RSI at 73.84 signals momentum is still climbing without being overextended on this timeframe. The entry zone between 730.475 and 731.585 aligns with the 1h price of 731.030, offering a precise trigger for a long. If price pushes toward TP1 at 740.522 and then TP2 at 746.851, the move targets a measured extension of that volatility. The line in the sand is invalidation at 722.330, where a break would negate the entire structure. This is a trend-following setup, not a counter-trend gamble, so size accordingly and defend the invalidation level ruthlessly.
Debate:
Are you ready to defend the 722.330 invalidation or waiting for a pullback entry?
Click here to view the chart 👇️
⚠️ Personal market analysis only. NFA — manage risk and DYOR.
Educational content, not investment advice or a recommendation to buy, sell, deposit, or withdraw any asset. No paid promotion or referral/affiliate links.