Quick update on $STEEM since the last call.
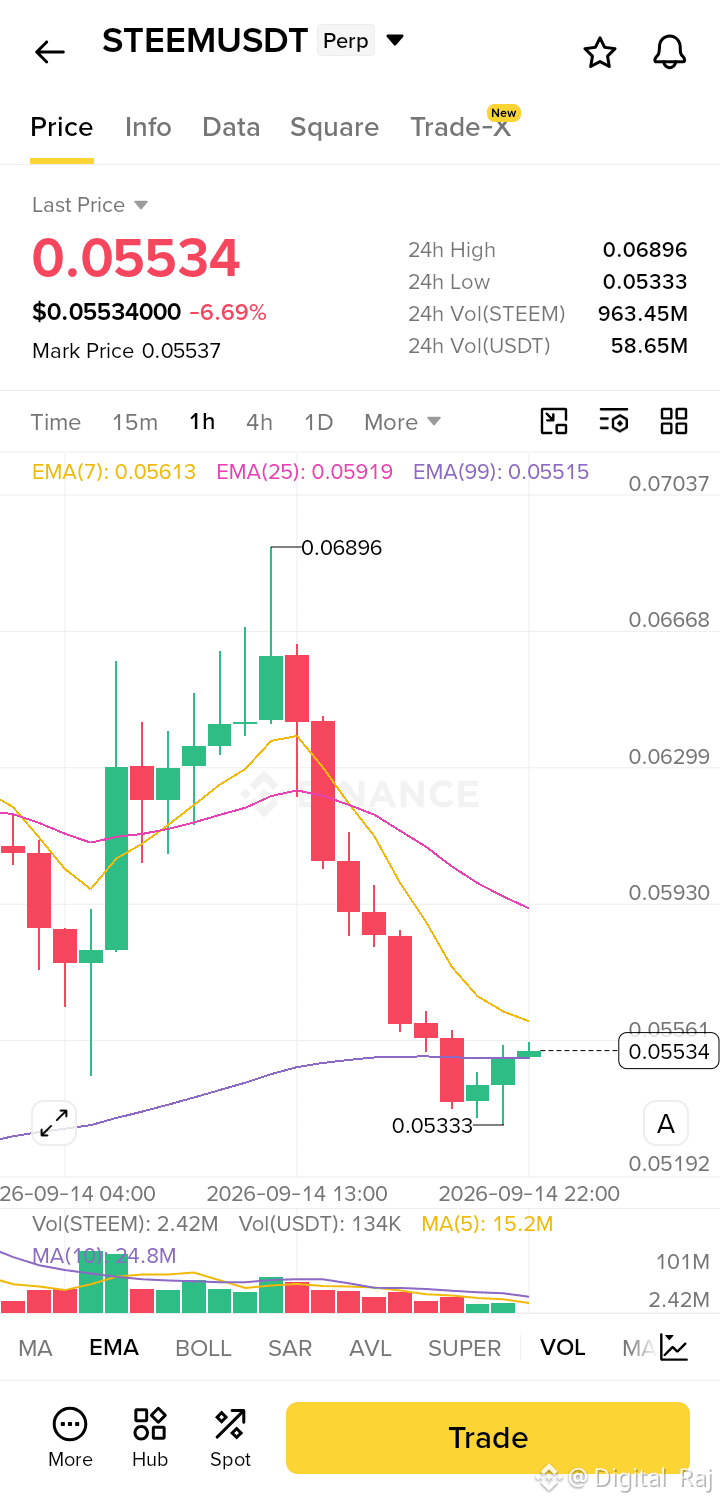
The plan was clear: hold above 0.058, bounce toward 0.075. That's not what played out. Price broke below 0.058, dropped to a low of 0.0533, and is now sitting around 0.0553-0.0620 — the structure I was watching got invalidated.
No point dressing this up. The bounce didn't hold, sellers stayed in control, and the level that mattered got taken out. That's part of trading — not every setup plays out, and pretending otherwise helps no one.
What changes now: with 0.058 gone, the next real zone to watch is 0.050-0.052 — if that holds, a base could start forming there instead. Until then, this is a "wait and watch" chart, not a "buy the dip" chart.
Sharing this update because calling out what didn't work matters just as much as calling out what does. That's how you actually learn to read these charts better — not by only remembering the wins.$STEEM
The plan was clear: hold above 0.058, bounce toward 0.075. That's not what played out. Price broke below 0.058, dropped to a low of 0.0533, and is now sitting around 0.0553-0.0620 — the structure I was watching got invalidated.
No point dressing this up. The bounce didn't hold, sellers stayed in control, and the level that mattered got taken out. That's part of trading — not every setup plays out, and pretending otherwise helps no one.
What changes now: with 0.058 gone, the next real zone to watch is 0.050-0.052 — if that holds, a base could start forming there instead. Until then, this is a "wait and watch" chart, not a "buy the dip" chart.
Sharing this update because calling out what didn't work matters just as much as calling out what does. That's how you actually learn to read these charts better — not by only remembering the wins.$STEEM