
loweef
8 投稿

loweef
報告
ユーザーをブロック
Free TradingView indicators: Market, Funding, Cost & Session Compass · Crypto market structure & trading-cost education · X @loweef_io
0 フォロー
1 フォロワー
4 いいね
投稿
·
--
翻訳参照
Did Bitcoin just lose its range, or only its post-election premium?
What happened: the Nasdaq 100 fell about 6% on Thursday as chipmakers sold off on AI regulation fears, and BTC dropped roughly 5.5% to around 75.7K in the same session (Bloomberg, via Binance News). Most of the move came in just two hourly candles.
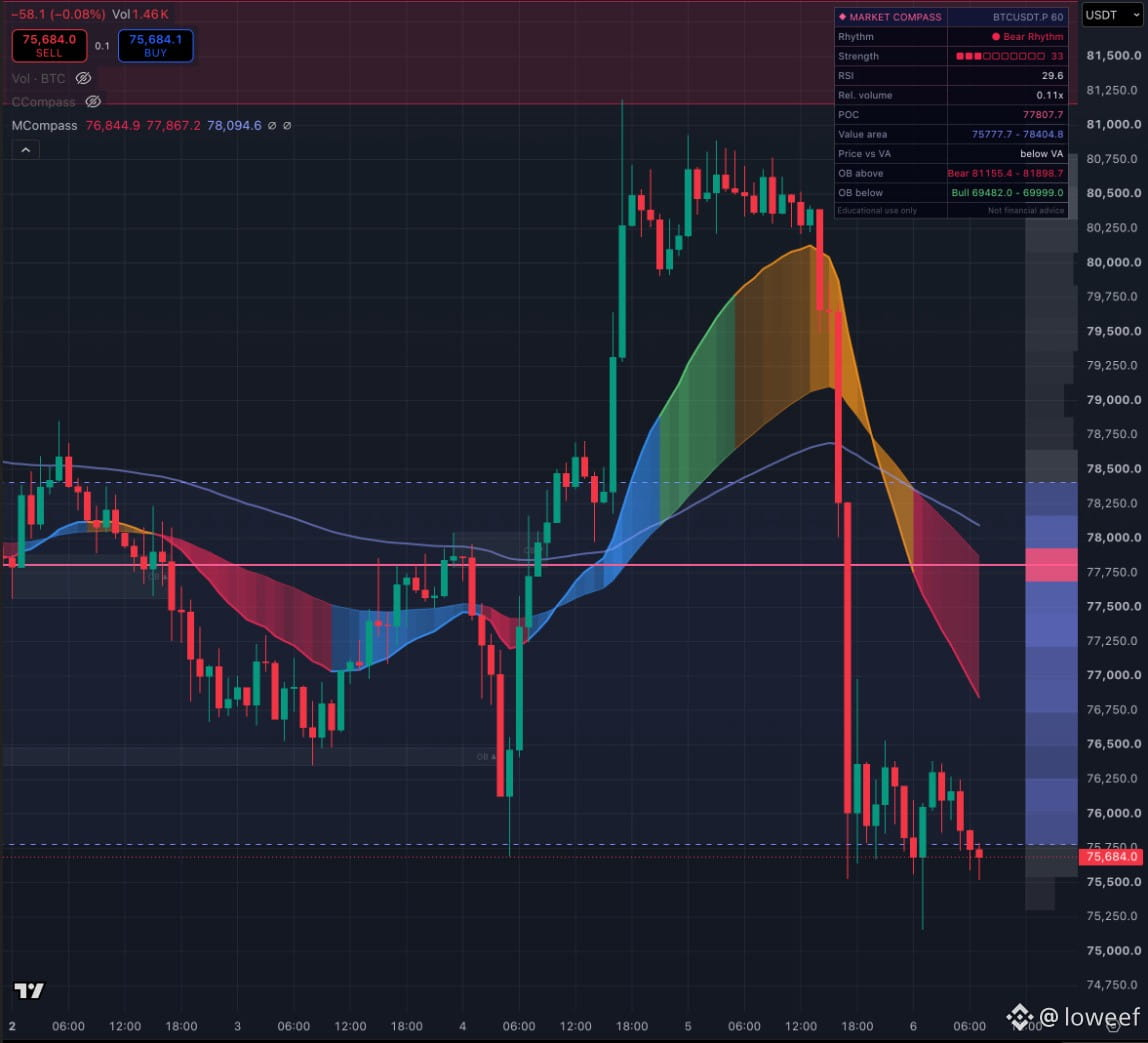
The chart (BTC perp, 1H): price fell from the 80K shelf straight through the volume POC near 77.8K and now sits on the lower edge of the value area, around 75.8K. The trend ribbon has turned bearish and hourly RSI is near 30.
My read: this looks like a liquidity air pocket, not slow distribution. Price skipped most of the value area, so very little trading happened between 80K and 76K. If 75.8K fails on a closing basis, the next visible demand zone on this chart sits much lower, near 69.5K-70K. If buyers reclaim 77.8K, the drop reads more like a macro flush than a trend change. I'm watching whether hourly volume expands on bounces or only on red candles.
Does BTC defend the value-area low, or do equities drag it toward 70K first?
$BTC #USStocksSlipandCryptoMarketUnderBroadPressure #Bitcoin #CryptoMarket
Did Bitcoin just lose its range, or only its post-election premium?
What happened: the Nasdaq 100 fell about 6% on Thursday as chipmakers sold off on AI regulation fears, and BTC dropped roughly 5.5% to around 75.7K in the same session (Bloomberg, via Binance News). Most of the move came in just two hourly candles.
The chart (BTC perp, 1H): price fell from the 80K shelf straight through the volume POC near 77.8K and now sits on the lower edge of the value area, around 75.8K. The trend ribbon has turned bearish and hourly RSI is near 30.
My read: this looks like a liquidity air pocket, not slow distribution. Price skipped most of the value area, so very little trading happened between 80K and 76K. If 75.8K fails on a closing basis, the next visible demand zone on this chart sits much lower, near 69.5K-70K. If buyers reclaim 77.8K, the drop reads more like a macro flush than a trend change. I'm watching whether hourly volume expands on bounces or only on red candles.
Does BTC defend the value-area low, or do equities drag it toward 70K first?
$BTC #USStocksSlipandCryptoMarketUnderBroadPressure #Bitcoin #CryptoMarket
What happened: the Nasdaq 100 fell about 6% on Thursday as chipmakers sold off on AI regulation fears, and BTC dropped roughly 5.5% to around 75.7K in the same session (Bloomberg, via Binance News). Most of the move came in just two hourly candles.
The chart (BTC perp, 1H): price fell from the 80K shelf straight through the volume POC near 77.8K and now sits on the lower edge of the value area, around 75.8K. The trend ribbon has turned bearish and hourly RSI is near 30.
My read: this looks like a liquidity air pocket, not slow distribution. Price skipped most of the value area, so very little trading happened between 80K and 76K. If 75.8K fails on a closing basis, the next visible demand zone on this chart sits much lower, near 69.5K-70K. If buyers reclaim 77.8K, the drop reads more like a macro flush than a trend change. I'm watching whether hourly volume expands on bounces or only on red candles.
Does BTC defend the value-area low, or do equities drag it toward 70K first?
$BTC #USStocksSlipandCryptoMarketUnderBroadPressure #Bitcoin #CryptoMarket
62
ログインして、さらにコンテンツを読む
厳選トピックで世界の暗号資産トレーダーの仲間入り
⚡️ 暗号資産に関する最新かつ有益な情報が見つかります。
💬 世界最大の暗号資産取引所から信頼されています。
👍 認証を受けたクリエイターから、有益なインサイトを得られます。
メール / 電話番号