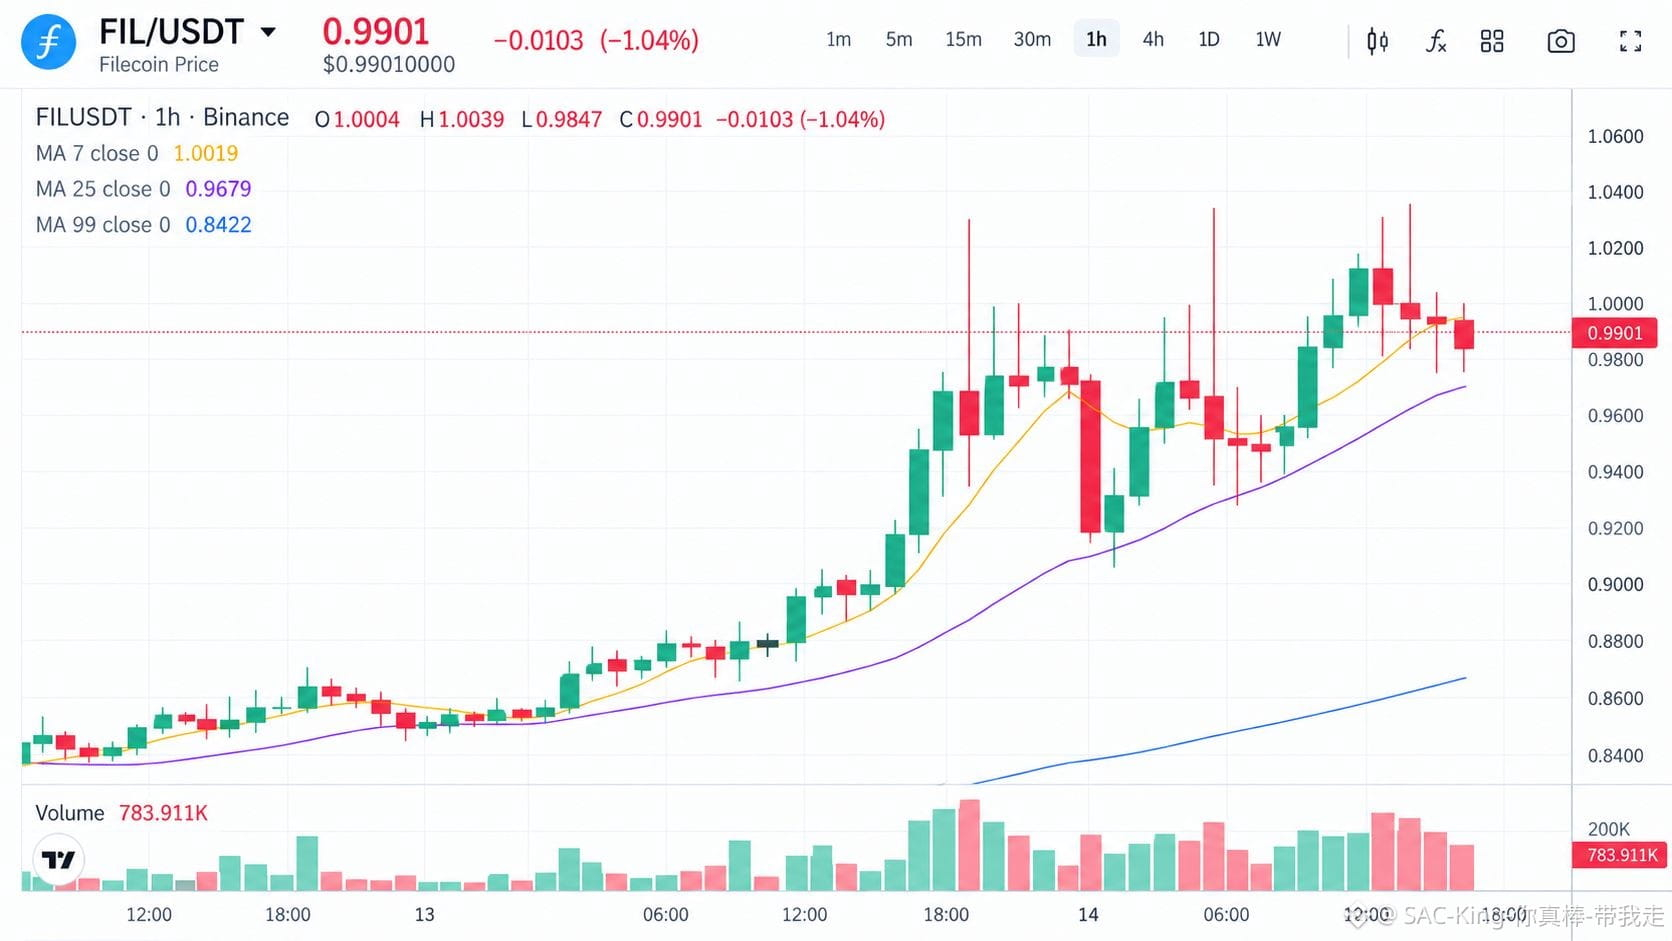

$FIL / USDT 1H Chart Analysis
Current Price: 0.9901
The 1H structure is short-term bullish but currently in a pullback.
Price moved from the ~0.94 area toward 1.01+, creating higher highs and higher lows. However, the latest candles show rejection around the 1.02 to 1.03 area and price has fallen back below the 7-period MA.
Trend: Bullish structure, short-term corrective
Momentum: Cooling after rejection from the 1.02+ region
Volume: Visible, but no strong volume expansion confirming a fresh breakout
🟢 Buy/Entry Zone: 0.9750 to 0.9850
🟡 Hold Zone: 0.9680 to 1.0020
🎯 TP1: 1.0180 to 1.0200
🎯 TP2: 1.0300
🛑 Stop-Loss/Invalidation
For a pullback-based long, a decisive 1H breakdown below ~0.9680 would materially weaken the bullish structure.
A tighter stop should only be chosen according to the actual entry and candle structure, rather than arbitrarily.
$FIL #FIL #GrowWithSAC
Current Price: 0.9901
The 1H structure is short-term bullish but currently in a pullback.
Price moved from the ~0.94 area toward 1.01+, creating higher highs and higher lows. However, the latest candles show rejection around the 1.02 to 1.03 area and price has fallen back below the 7-period MA.
Trend: Bullish structure, short-term corrective
Momentum: Cooling after rejection from the 1.02+ region
Volume: Visible, but no strong volume expansion confirming a fresh breakout
🟢 Buy/Entry Zone: 0.9750 to 0.9850
🟡 Hold Zone: 0.9680 to 1.0020
🎯 TP1: 1.0180 to 1.0200
🎯 TP2: 1.0300
🛑 Stop-Loss/Invalidation
For a pullback-based long, a decisive 1H breakdown below ~0.9680 would materially weaken the bullish structure.
A tighter stop should only be chosen according to the actual entry and candle structure, rather than arbitrarily.
$FIL #FIL #GrowWithSAC