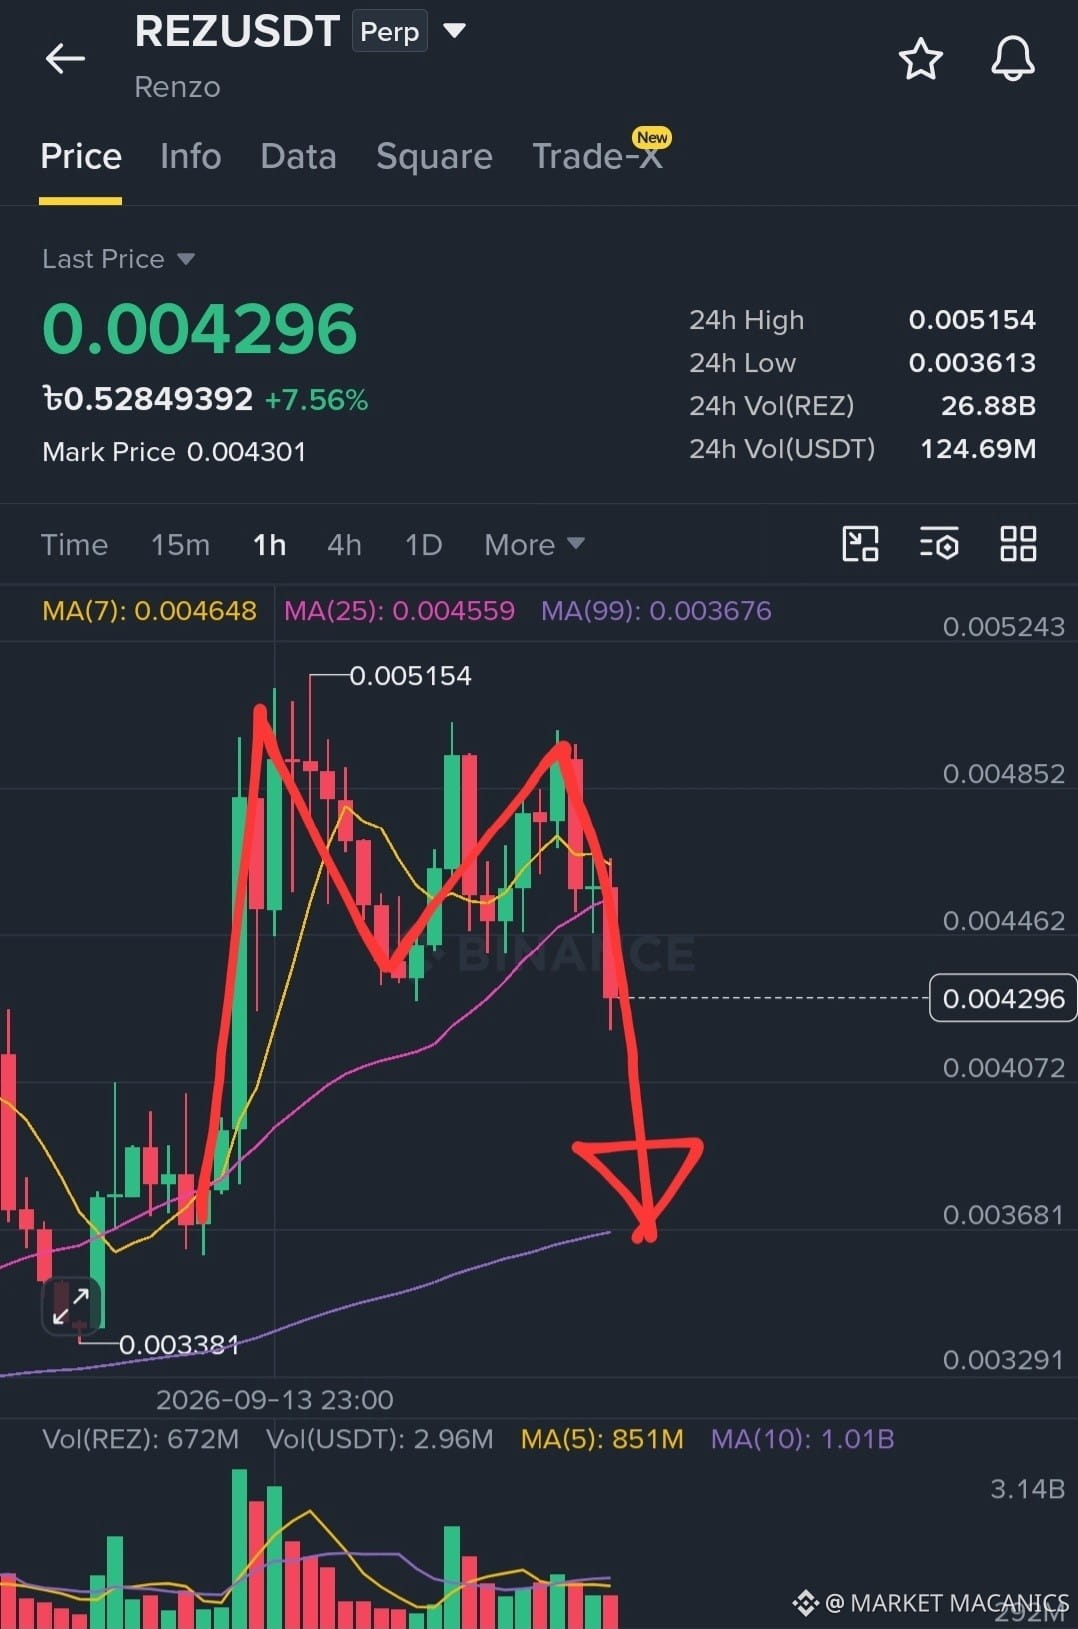
$REZ 🔥 REZ Bearish M Pattern — Sellers Eyeing a Breakdown 🐻
REZ is forming a bearish M pattern, signaling that sellers may be gaining control after repeated rejection from a key resistance area. 📉 The double-top structure suggests buyers are struggling to push price beyond the upper zone, creating a potential setup for a downside reversal.
The first peak showed strong buying interest, but the subsequent rejection indicates that selling pressure is increasing. 🐻 If REZ fails to reclaim the previous high and continues forming lower highs, the bearish structure could become increasingly convincing.
From a technical analysis perspective, the neckline is the critical level to watch. 📊 A decisive breakdown below the neckline with strong volume could confirm the M pattern and potentially open the way toward lower support zones. Until that happens, confirmation remains essential.
Market momentum will play a major role in the next move. 🔥 If sellers continue defending resistance while buyers lose strength, REZ could experience another wave of downside pressure. However, a strong breakout above the pattern's upper resistance would weaken or invalidate the bearish setup.
Overall, REZ is presenting a notable bearish M pattern as sellers attempt to establish control. 🚨 A confirmed neckline breakdown could bring fresh bearish momentum and increase selling pressure across the chart.
Keep watching the neckline, resistance, support, volume, and price confirmation closely. 📉 Trading decisions should be based on confirmed market structure rather than the pattern alone. 🔥
$BR
$AIN
REZ is forming a bearish M pattern, signaling that sellers may be gaining control after repeated rejection from a key resistance area. 📉 The double-top structure suggests buyers are struggling to push price beyond the upper zone, creating a potential setup for a downside reversal.
The first peak showed strong buying interest, but the subsequent rejection indicates that selling pressure is increasing. 🐻 If REZ fails to reclaim the previous high and continues forming lower highs, the bearish structure could become increasingly convincing.
From a technical analysis perspective, the neckline is the critical level to watch. 📊 A decisive breakdown below the neckline with strong volume could confirm the M pattern and potentially open the way toward lower support zones. Until that happens, confirmation remains essential.
Market momentum will play a major role in the next move. 🔥 If sellers continue defending resistance while buyers lose strength, REZ could experience another wave of downside pressure. However, a strong breakout above the pattern's upper resistance would weaken or invalidate the bearish setup.
Overall, REZ is presenting a notable bearish M pattern as sellers attempt to establish control. 🚨 A confirmed neckline breakdown could bring fresh bearish momentum and increase selling pressure across the chart.
Keep watching the neckline, resistance, support, volume, and price confirmation closely. 📉 Trading decisions should be based on confirmed market structure rather than the pattern alone. 🔥
$BR
$AIN