$BR — THIS CHART IS TELLING A CLEAR STORY
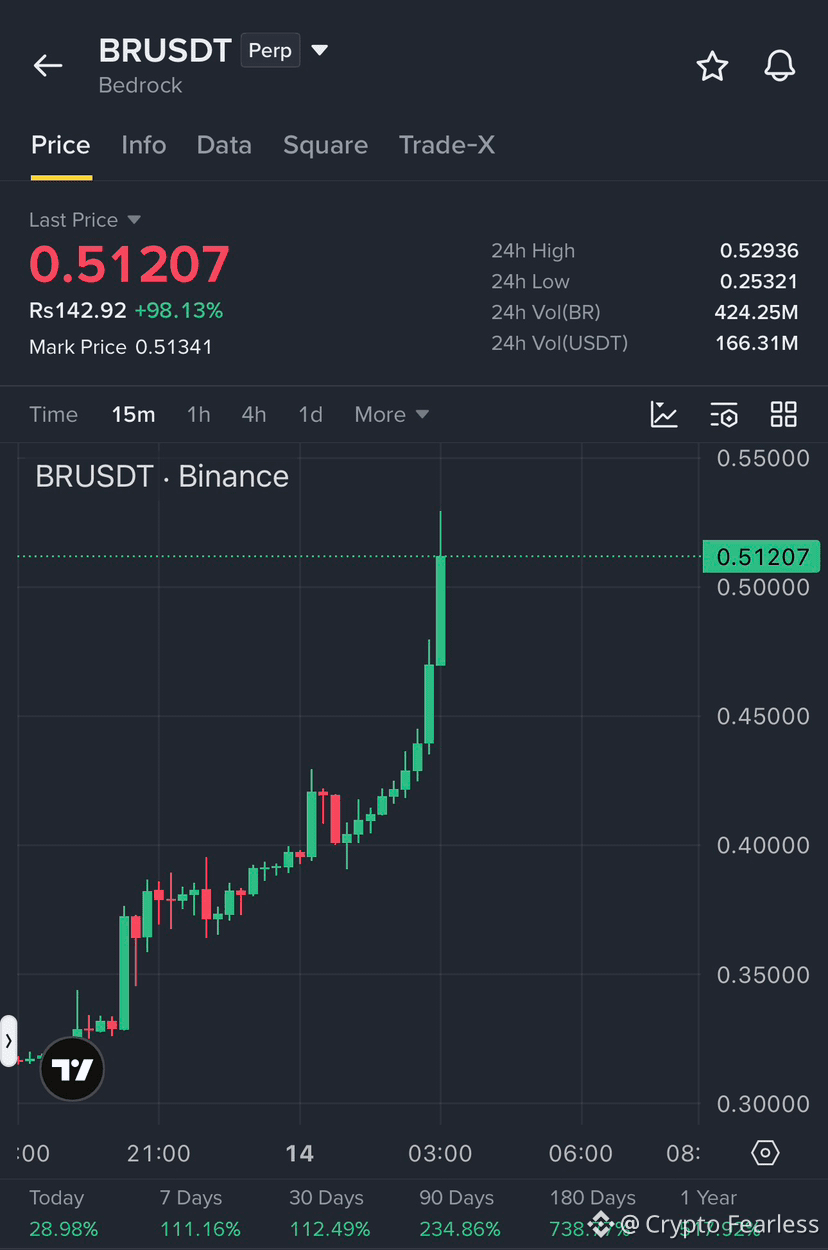
I’m looking at the 15-minute chart of $BRUS, and the price action is very strong.
$BRUS is trading around $0.512, after making a huge move from the $0.30 area. The chart shows a clear series of higher highs and higher lows, which means buyers are controlling the short-term trend.
The most important thing I see is that the move was not just one green candle. Price continued building higher step by step:
$0.30 → $0.35 → $0.40 → $0.45 → $0.50+
That is a strong momentum structure.
But now we are entering a very important area.
The $0.50 level is psychologically important. If buyers can keep price above $0.50 and turn this level into support, the next area I’m watching is around $0.53, which is close to the current 24H high.
A clean breakout above $0.53 could bring another momentum wave.
However, there is another side to this chart.
After a move of almost 100% in 24 hours, chasing the price at the top becomes risky. Strong coins can continue running, but they can also make fast pullbacks when early buyers start taking profits.
For me, these are the levels that matter:
$0.53 — major breakout zone
$0.50 — key psychological support
$0.47 — first pullback area
$0.45 — important short-term support
$0.40 — deeper support
If $BRUS holds above $0.50, I want to see buyers continue defending the level.
If $0.50 breaks with strong selling pressure, I would expect a deeper pullback before considering another move higher.
My view is simple:
Do not chase the green candles. Watch the levels.
The trend is strong, but the best traders are not the people who buy every pump. They wait for confirmation, manage risk, and let the chart come to them.
$BRUS is definitely on my watchlist now.
The next real test is $0.53.
#Binance #Crypto #CryptoTrading
I’m looking at the 15-minute chart of $BRUS, and the price action is very strong.
$BRUS is trading around $0.512, after making a huge move from the $0.30 area. The chart shows a clear series of higher highs and higher lows, which means buyers are controlling the short-term trend.
The most important thing I see is that the move was not just one green candle. Price continued building higher step by step:
$0.30 → $0.35 → $0.40 → $0.45 → $0.50+
That is a strong momentum structure.
But now we are entering a very important area.
The $0.50 level is psychologically important. If buyers can keep price above $0.50 and turn this level into support, the next area I’m watching is around $0.53, which is close to the current 24H high.
A clean breakout above $0.53 could bring another momentum wave.
However, there is another side to this chart.
After a move of almost 100% in 24 hours, chasing the price at the top becomes risky. Strong coins can continue running, but they can also make fast pullbacks when early buyers start taking profits.
For me, these are the levels that matter:
$0.53 — major breakout zone
$0.50 — key psychological support
$0.47 — first pullback area
$0.45 — important short-term support
$0.40 — deeper support
If $BRUS holds above $0.50, I want to see buyers continue defending the level.
If $0.50 breaks with strong selling pressure, I would expect a deeper pullback before considering another move higher.
My view is simple:
Do not chase the green candles. Watch the levels.
The trend is strong, but the best traders are not the people who buy every pump. They wait for confirmation, manage risk, and let the chart come to them.
$BRUS is definitely on my watchlist now.
The next real test is $0.53.
#Binance #Crypto #CryptoTrading