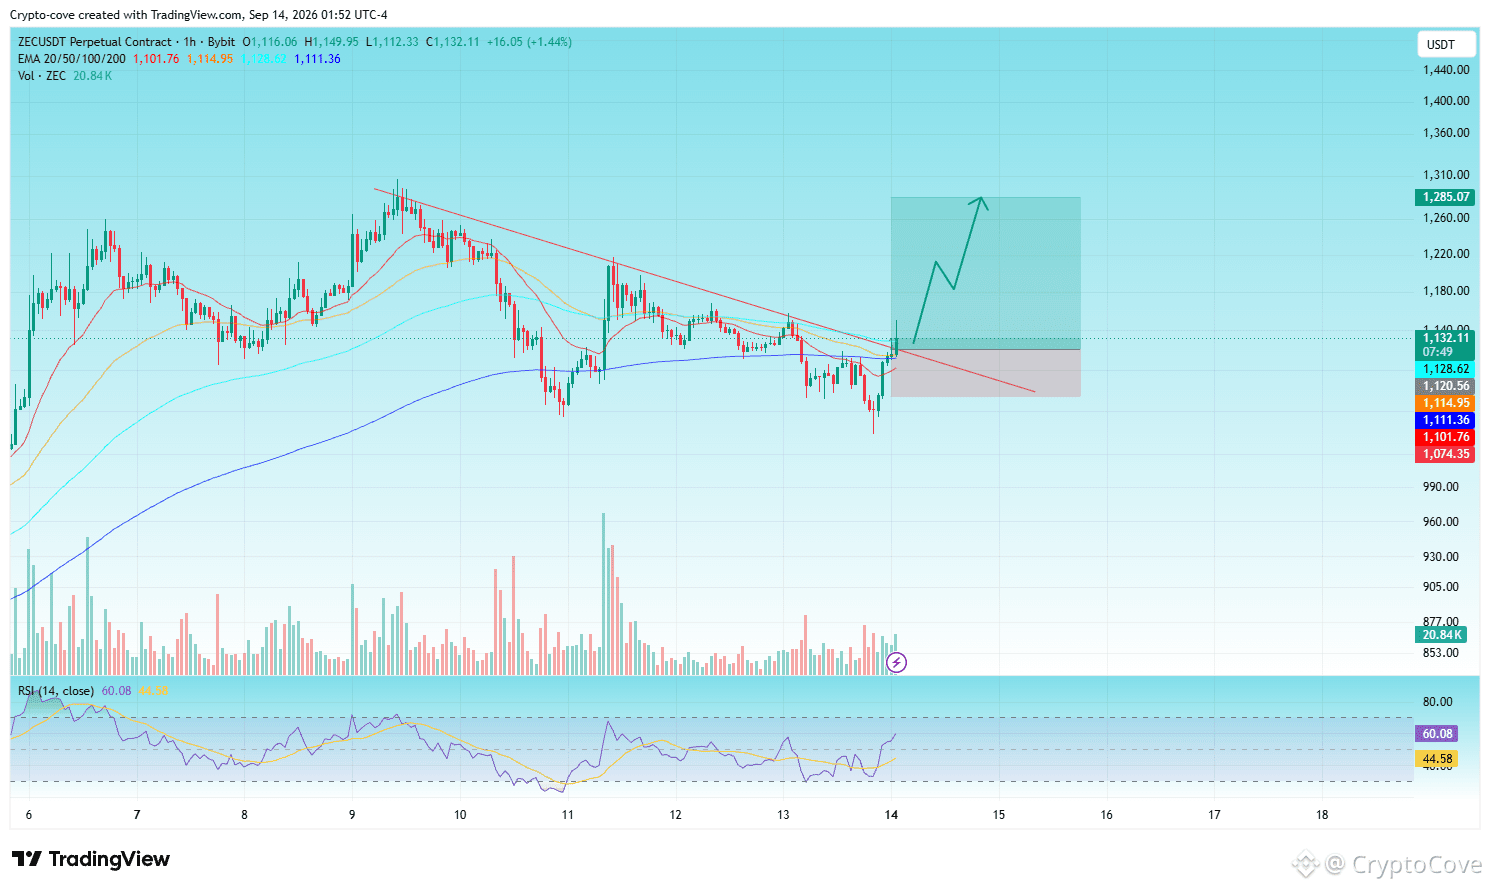

$ZEC breaks it's downtrend resistance in 1h timeframe another big push to the upside
AS you can see in my added photo that $ZEC was following a massive downtrend in 1h timeframe. Now I can see ZEC breaks it's resistance so technically ZEC is following uptrend some key level you must need to check before another long
If market close any candle bellow trend support that breakout become fake out then market can dump hard because trapped so many buyers and short seller SL..
If market touch 1200 $ey resistance level there is high chance market can touch 1300$ too.....
Now technical target says market can touch 1300 level if maintain uptrend movement....
If ZEC holds 1070 range then we can expect zec can touch 1300$ level or another uptrend.....
I am expecting another uptrend from current market price with proper risk and money management If you want you can follow my trade setup
Signal type- Long
leverage 10x-7x
Entry prrice-1130-1120
1st tp- 1170
2nd tp- 1216
3rd tp- 1284
SL- 1073
🟡 CC Confidence Score: MEDIUM
AS you can see in my added photo that $ZEC was following a massive downtrend in 1h timeframe. Now I can see ZEC breaks it's resistance so technically ZEC is following uptrend some key level you must need to check before another long
If market close any candle bellow trend support that breakout become fake out then market can dump hard because trapped so many buyers and short seller SL..
If market touch 1200 $ey resistance level there is high chance market can touch 1300$ too.....
Now technical target says market can touch 1300 level if maintain uptrend movement....
If ZEC holds 1070 range then we can expect zec can touch 1300$ level or another uptrend.....
I am expecting another uptrend from current market price with proper risk and money management If you want you can follow my trade setup
Signal type- Long
leverage 10x-7x
Entry prrice-1130-1120
1st tp- 1170
2nd tp- 1216
3rd tp- 1284
SL- 1073
🟡 CC Confidence Score: MEDIUM