


XAU/USD (Gold) Day Trading Analysis: New York Session
📈 1. Executive Summary & Market Context
💰 Current Market Price: XAU/USD is hovering around $4,335 – $4,340 heading into the New York session.
🌍 Macro Environment: Gold is trading with a cautiously defensive bias. Markets are heavily digesting rising oil prices, sticky inflation expectations, and mounting speculation over upcoming central bank rate decisions.
📉 Session Bias: Neutral-to-Bearish intraday. While gold attempted a recovery late last week off the 100-day Simple Moving Average (SMA), sellers continue to fiercely defend psychological overhead resistance near $4,400.
🗺️ 2. Key Technical Levels for the New York Session
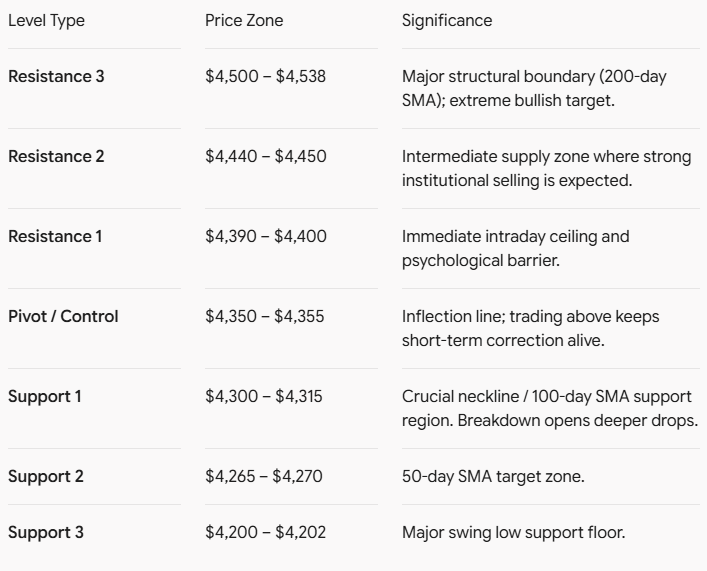
🕯️ 3. Candlestick & Price Action Structure (USD Chart)
📊 Daily & 4-Hour Structure: The chart prints a potential broader Head-and-Shoulders variation or a descending consolidation pattern. Candles show long upper wicks whenever prices probe past $4,375–$4,400, indicating active sell-on-rally behavior by institutional participants.
⚡ Momentum Indicators:
📉 The Relative Strength Index (RSI) on the 4H/Daily timeframe sits below the 50 midline (roughly 46–48), signaling lingering downside momentum.
📊 Volume Profiles show shrinking participation on minor upward pushes, while selling volume spikes on sharp retracements.
🎯 4. Day Trading Scenarios & Game Plan
📉 Scenario A: Bearish Continuation (Breakdown Play)
⚡ Trigger: A clean 15-minute or 1-hour candle close below $4,330, followed by a retest that fails to reclaim the level.
📉 Execution: Enter Short.
🎯 Targets: $4,300 (Neckline/SMA test), with an extended extension toward $4,270.
🛡️ Stop Loss: Tight stop just above $4,355.
📈 Scenario B: Bullish Mean-Reversion / Range Bounce
⚡ Trigger: Price successfully defends the $4,310 – $4,320 floor, printing a bullish reversal candlestick pattern (e.g., a hammer or a strong engulfing bar) on the 15M/1H chart.
📈 Execution: Enter Long for a counter-trend scalp.
🎯 Targets: $4,365 and $4,395.
🛡️ Stop Loss: Placed strictly below $4,295.
📋 5. How to Prepare for Today's New York Session
📝 Mark Your Charts Early: Map out the exact zones mentioned above ($4,400 resistance down to $4,300 support) on your platform before the opening bell rings.
💵 Watch the US Dollar Index (DXY) and Yields: Keep a live correlation tab open. If US Treasury yields tick higher or the DXY surges, expect immediate downward pressure on XAU/USD.
⚖️ Manage Position Sizing: Because gold is reacting heavily to macro headline risks, volatility can trigger sudden wicks that hunt loose stops. Keep risk per trade tightly budgeted (e.g., 1% to 2% of your account equity).
🧘 Avoid Forceful Trades: If price chops sideways inside the $4,330–$4,360 range during the initial hour of the NY open, sit on your hands and wait for a definitive structural break of either boundary.
🏷️#GoldTradingStrategy 🏷️#XAUUSDNewYorkSession 🏷️#DayTradingGoldMarket
🏷️#GoldPriceActionAnalysis 🏷️#ForexTradingCommunity