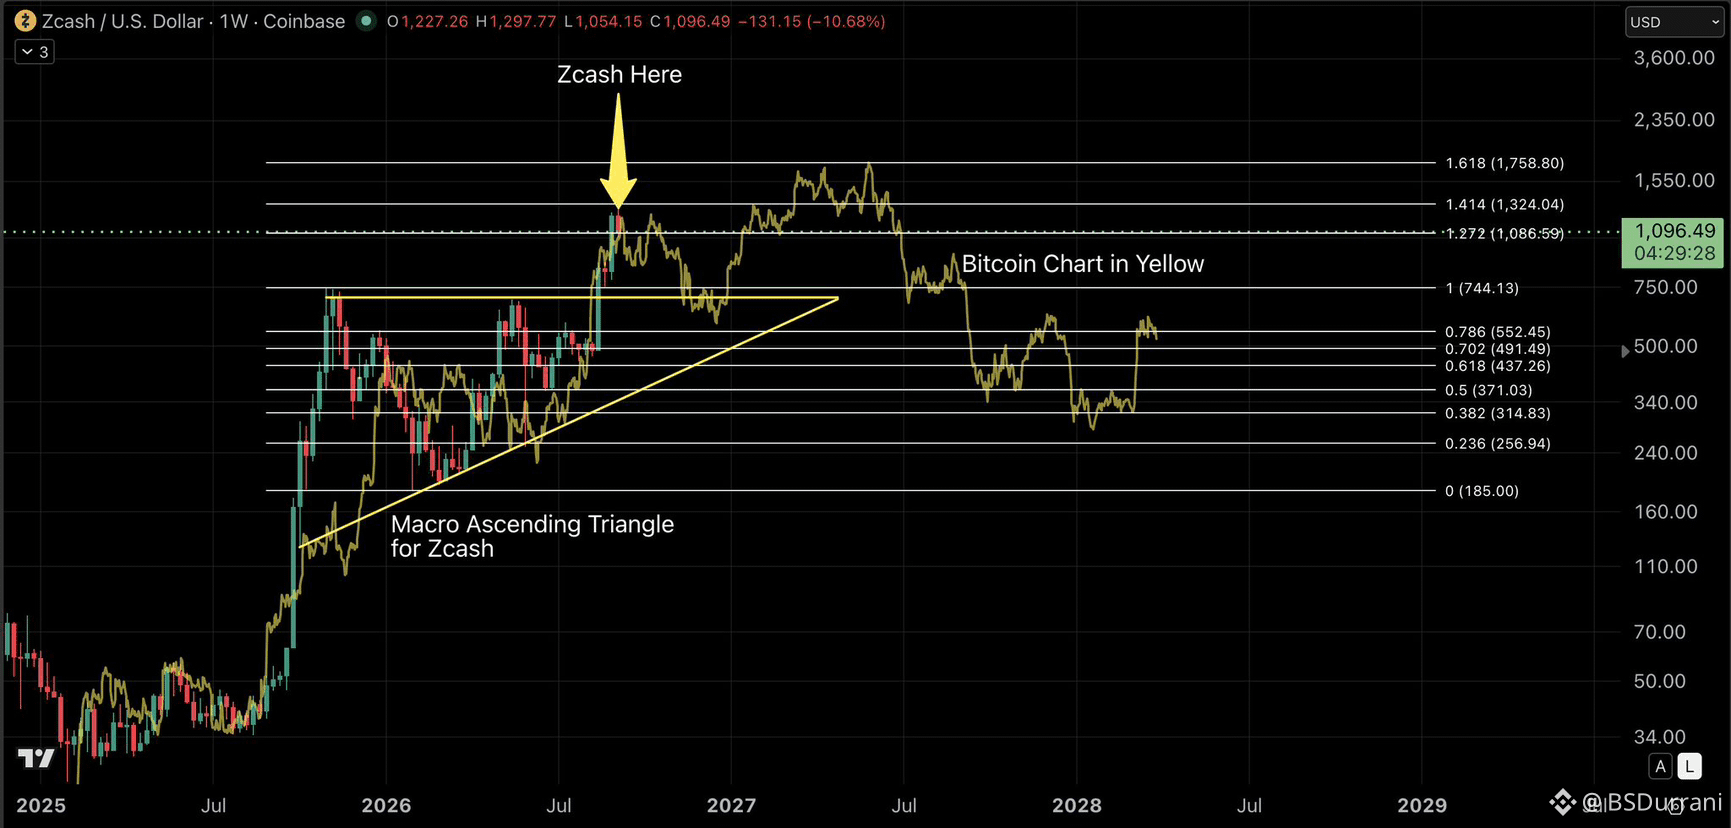
I told you guys earlier that I thought I had found the Zcash blueprint. Here’s what I meant.
My analysis of the $ZEC chart alone had already given me a potential macro target around $1,700, with the 1.618 logarithmic Fib extension currently sitting near $1,760.
Then I overlaid an earlier Bitcoin structure onto Zcash. Look at the geometry. I’m not comparing dates or timeframes.
Markets are fractal, and algorithmic price structures can repeat across completely different periods. What interests me is the sequence and geometry of the price action.
Bitcoin appears to have already traveled a remarkably similar path to the one Zcash is traveling now.
And here’s where it gets really interesting:
Bitcoin’s corresponding major high aligns almost perfectly with Zcash’s 1.618 Fib extension, the same ~$1,700 area I was already watching from the ZEC chart alone.
If this blueprint continues to play out, I would also expect a significant correction coming, potentially bringing ZEC back toward the upper rail of its former macro ascending triangle before the next major phase.
This isn't about Zcash copying Bitcoin candle for candle. It’s about similar geometry, similar market psychology, and potentially similar algorithms.
Now we watch and see how closely the blueprint continues to track.
$ZEC #Zcash #Bitcoin #BTC
My analysis of the $ZEC chart alone had already given me a potential macro target around $1,700, with the 1.618 logarithmic Fib extension currently sitting near $1,760.
Then I overlaid an earlier Bitcoin structure onto Zcash. Look at the geometry. I’m not comparing dates or timeframes.
Markets are fractal, and algorithmic price structures can repeat across completely different periods. What interests me is the sequence and geometry of the price action.
Bitcoin appears to have already traveled a remarkably similar path to the one Zcash is traveling now.
And here’s where it gets really interesting:
Bitcoin’s corresponding major high aligns almost perfectly with Zcash’s 1.618 Fib extension, the same ~$1,700 area I was already watching from the ZEC chart alone.
If this blueprint continues to play out, I would also expect a significant correction coming, potentially bringing ZEC back toward the upper rail of its former macro ascending triangle before the next major phase.
This isn't about Zcash copying Bitcoin candle for candle. It’s about similar geometry, similar market psychology, and potentially similar algorithms.
Now we watch and see how closely the blueprint continues to track.
$ZEC #Zcash #Bitcoin #BTC