ADA: the bounce is losing pace near a bigger hurdle
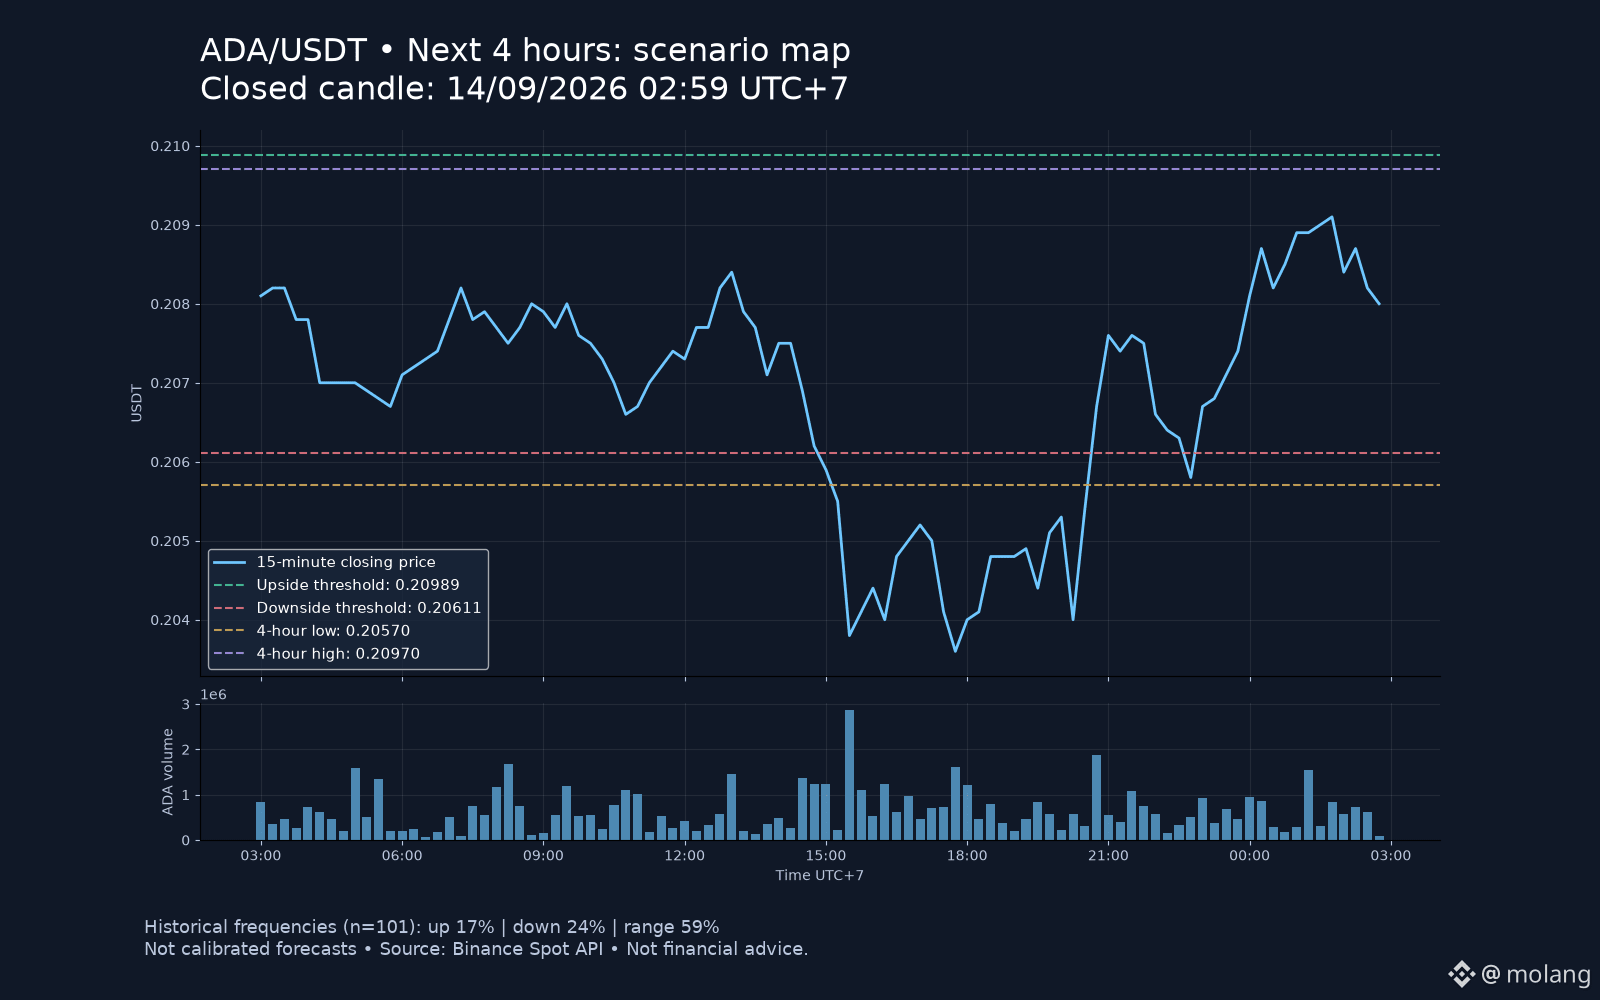
At 02:59 on September 14 (UTC+7), ADA/USDT spot closed at $0.20800: above its 1h EMA20 ($0.20703), but below the 4h EMA20 ($0.20835). The last closed 15-minute candle's volume was just 16% of the previous 20-candle average. One quiet candle doesn't predict direction, but it gives me little reason to chase this recovery.
For the four hours ending around 07:00 UTC+7, I'm watching three outcomes. These refer to the FINAL price, not a brief touch:
🟢 Upside — finish above $0.20989. Historical reference: 17%. Reclaiming the 4h average, then closing above the recent four-hour high of $0.20970 and holding a retest, would strengthen continuation toward $0.20989. Falling back below $0.20970 weakens the breakout case.
🟡 Range — finish within $0.20611–$0.20989. Reference: 59%. Repeated failed breaks would fit this outcome; sustained trading outside either boundary would challenge it. A range endpoint still allows a volatile path.
🔴 Downside — finish below $0.20611. Reference: 24%. Losing the 1h average first, then breaking $0.20611 and failing to reclaim it, would bring the recent four-hour low of $0.20570 into focus. A sustained reclaim of $0.20611 weakens that breakdown setup.
Those figures come from 101 non-overlapping four-hour windows over August 3–September 14, filtered by the same side of price versus the 1h EMA20. Each window uses its own ±ATR14 hourly band. Approximate 95% sampling intervals: upside 11–25%, downside 17–33%, range 50–68%. This simple baseline doesn't match today's volume or 4h trend; it's not an out-of-sample calibrated forecast or trade win rate.
My read: wait for participation to return at the marked levels. High leverage magnifies losses and liquidation exposure; fees and slippage matter especially when targets are close. These are spot reference levels, not executable futures orders.
Source: Binance Spot API, closed ADAUSDT 15m/1h/4h candles. Chart levels rounded to five decimals.
#ADA #Cardano
Not financial advice.
At 02:59 on September 14 (UTC+7), ADA/USDT spot closed at $0.20800: above its 1h EMA20 ($0.20703), but below the 4h EMA20 ($0.20835). The last closed 15-minute candle's volume was just 16% of the previous 20-candle average. One quiet candle doesn't predict direction, but it gives me little reason to chase this recovery.
For the four hours ending around 07:00 UTC+7, I'm watching three outcomes. These refer to the FINAL price, not a brief touch:
🟢 Upside — finish above $0.20989. Historical reference: 17%. Reclaiming the 4h average, then closing above the recent four-hour high of $0.20970 and holding a retest, would strengthen continuation toward $0.20989. Falling back below $0.20970 weakens the breakout case.
🟡 Range — finish within $0.20611–$0.20989. Reference: 59%. Repeated failed breaks would fit this outcome; sustained trading outside either boundary would challenge it. A range endpoint still allows a volatile path.
🔴 Downside — finish below $0.20611. Reference: 24%. Losing the 1h average first, then breaking $0.20611 and failing to reclaim it, would bring the recent four-hour low of $0.20570 into focus. A sustained reclaim of $0.20611 weakens that breakdown setup.
Those figures come from 101 non-overlapping four-hour windows over August 3–September 14, filtered by the same side of price versus the 1h EMA20. Each window uses its own ±ATR14 hourly band. Approximate 95% sampling intervals: upside 11–25%, downside 17–33%, range 50–68%. This simple baseline doesn't match today's volume or 4h trend; it's not an out-of-sample calibrated forecast or trade win rate.
My read: wait for participation to return at the marked levels. High leverage magnifies losses and liquidation exposure; fees and slippage matter especially when targets are close. These are spot reference levels, not executable futures orders.
Source: Binance Spot API, closed ADAUSDT 15m/1h/4h candles. Chart levels rounded to five decimals.
#ADA #Cardano
Not financial advice.