🔥 TIA/USDT — SHORT SETUP | Conf. 86%
$TIA
TIA just got rejected from a major resistance area.
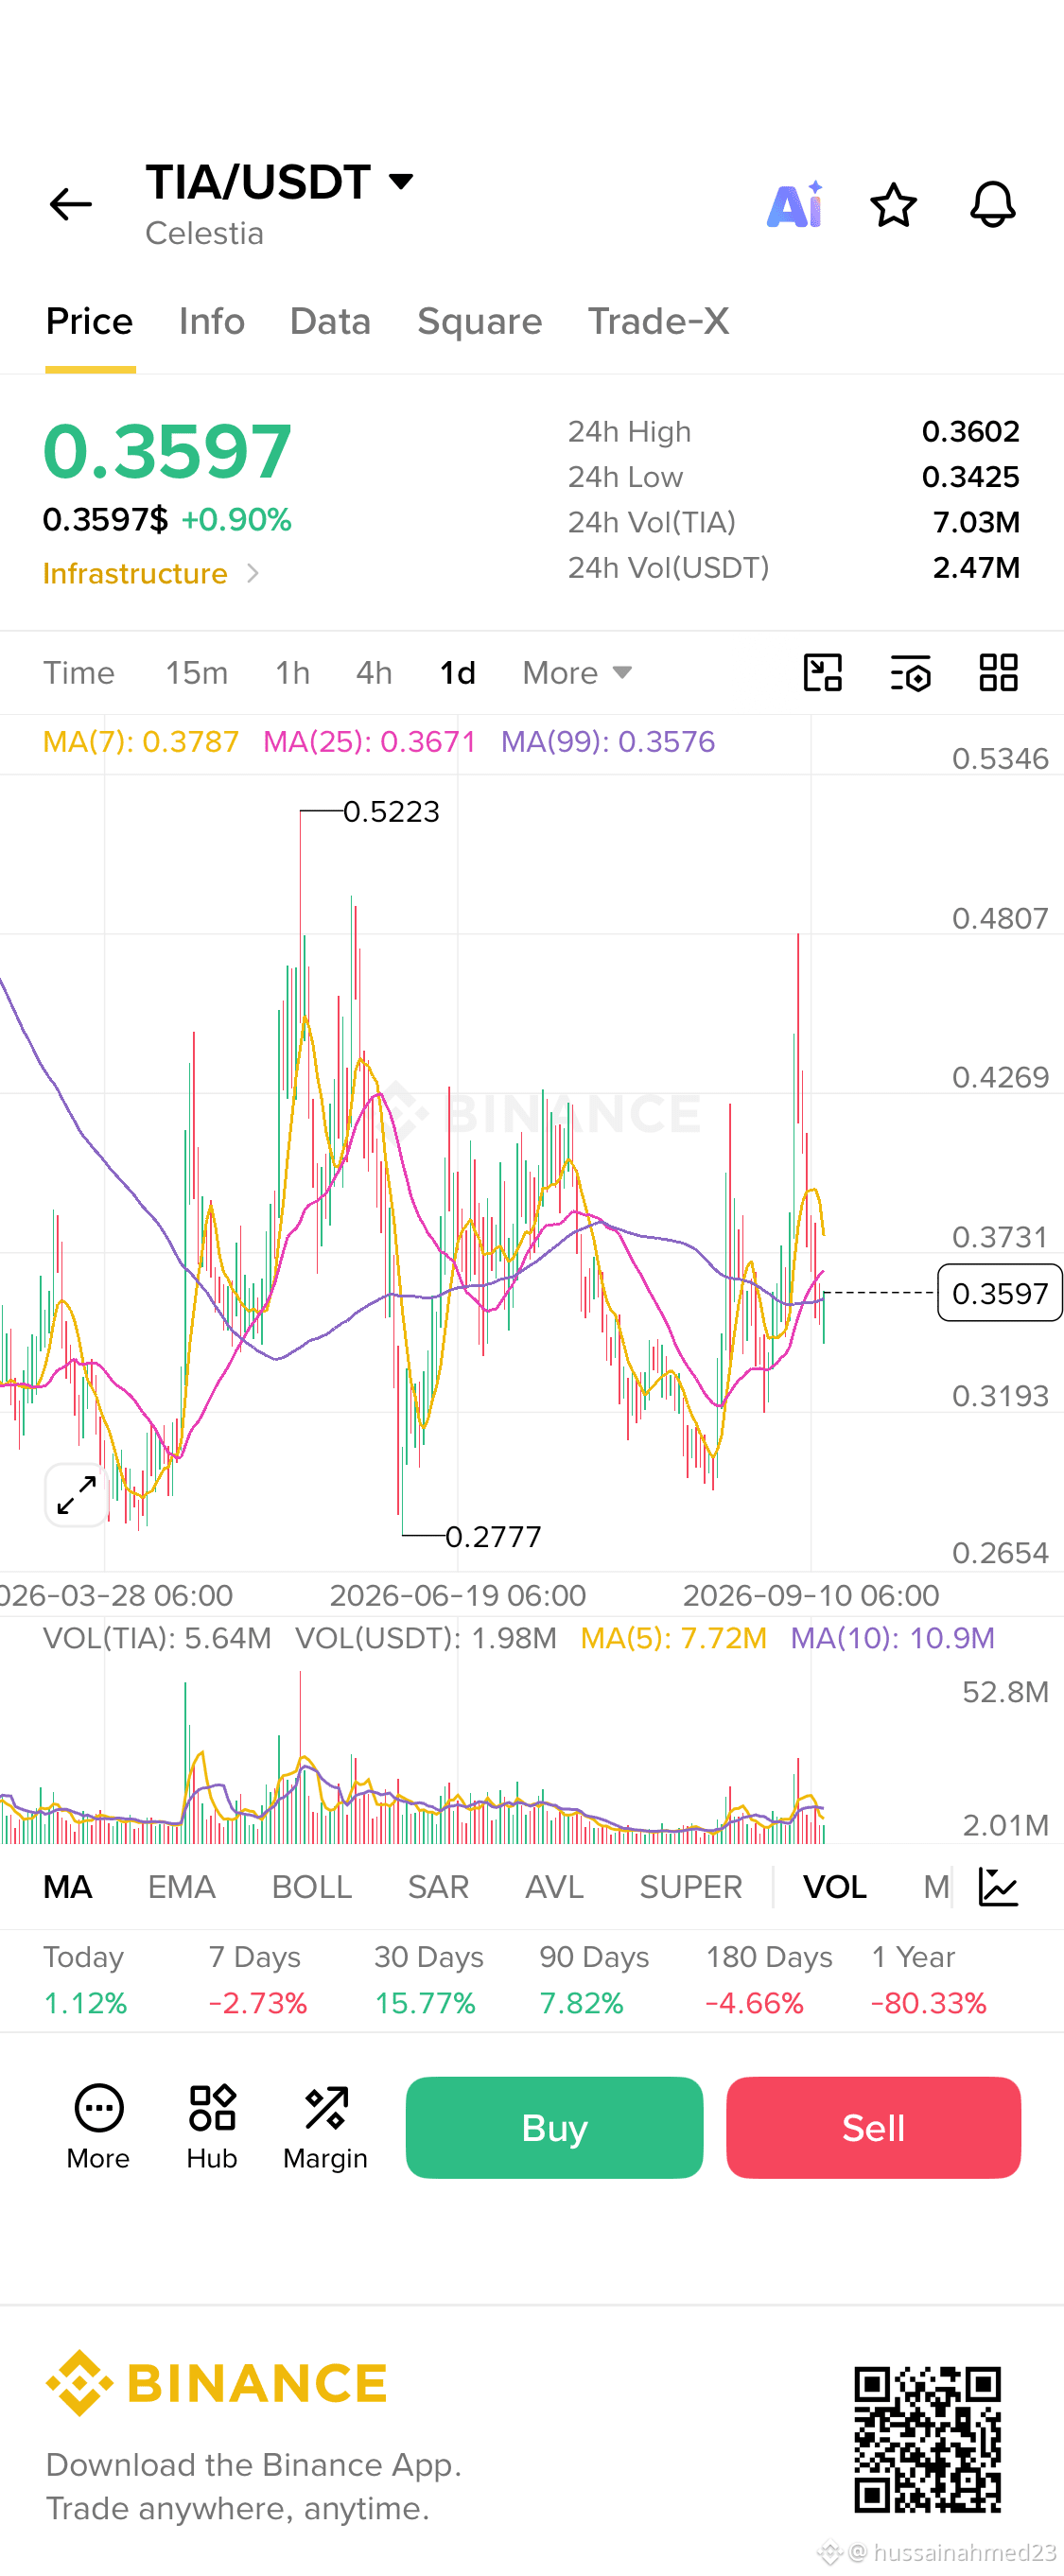
The daily structure is trying to recover, but price is still struggling to reclaim the key moving-average cluster around 0.367–0.379.
If bulls fail to regain this zone, another short-term pullback could be on the table. 👀
🎯 TRADE PLAN
🔴 Direction: SHORT
📍 Entry Zone: 0.3670 – 0.3790
🛑 Stop Loss: 0.3910
🎯 TP1: 0.3500
🎯 TP2: 0.3350
🎯 TP3: 0.3190
🧠 WHY THIS SETUP?
• Current price: 0.3597
• MA(7): 0.3787
• MA(25): 0.3671
• MA(99): 0.3576
TIA is currently trading below MA(7) and MA(25), which makes the 0.367–0.379 region an important resistance/retest zone.
The recent spike toward 0.48 was strongly rejected, and price has now returned toward the MA cluster. A failed recovery from this area could trigger another move lower.
⚠️ However, the daily chart is not completely bearish — price is still holding around the MA(99). So this is a short-term pullback setup, not a call for a long-term downtrend.
🚨 INVALIDATION
A strong daily reclaim above 0.391 would weaken this setup and suggest that buyers are regaining control.
📊 THE REAL QUESTION
Will TIA reject 0.367–0.379 and move toward TP2,
or will bulls reclaim the MA cluster and push back toward 0.40+? 🔥
SHORT or LONG? Drop your bias below 👇
📈 Click here to view the chart
⚠️ Personal market analysis only. NFA — manage risk and DYOR.
Educational content only. Not investment advice or a recommendation to buy, sell, deposit, or withdraw any asset. No paid promotion or referral/affiliate links.
$TIA
TIA just got rejected from a major resistance area.
The daily structure is trying to recover, but price is still struggling to reclaim the key moving-average cluster around 0.367–0.379.
If bulls fail to regain this zone, another short-term pullback could be on the table. 👀
🎯 TRADE PLAN
🔴 Direction: SHORT
📍 Entry Zone: 0.3670 – 0.3790
🛑 Stop Loss: 0.3910
🎯 TP1: 0.3500
🎯 TP2: 0.3350
🎯 TP3: 0.3190
🧠 WHY THIS SETUP?
• Current price: 0.3597
• MA(7): 0.3787
• MA(25): 0.3671
• MA(99): 0.3576
TIA is currently trading below MA(7) and MA(25), which makes the 0.367–0.379 region an important resistance/retest zone.
The recent spike toward 0.48 was strongly rejected, and price has now returned toward the MA cluster. A failed recovery from this area could trigger another move lower.
⚠️ However, the daily chart is not completely bearish — price is still holding around the MA(99). So this is a short-term pullback setup, not a call for a long-term downtrend.
🚨 INVALIDATION
A strong daily reclaim above 0.391 would weaken this setup and suggest that buyers are regaining control.
📊 THE REAL QUESTION
Will TIA reject 0.367–0.379 and move toward TP2,
or will bulls reclaim the MA cluster and push back toward 0.40+? 🔥
SHORT or LONG? Drop your bias below 👇
📈 Click here to view the chart
⚠️ Personal market analysis only. NFA — manage risk and DYOR.
Educational content only. Not investment advice or a recommendation to buy, sell, deposit, or withdraw any asset. No paid promotion or referral/affiliate links.