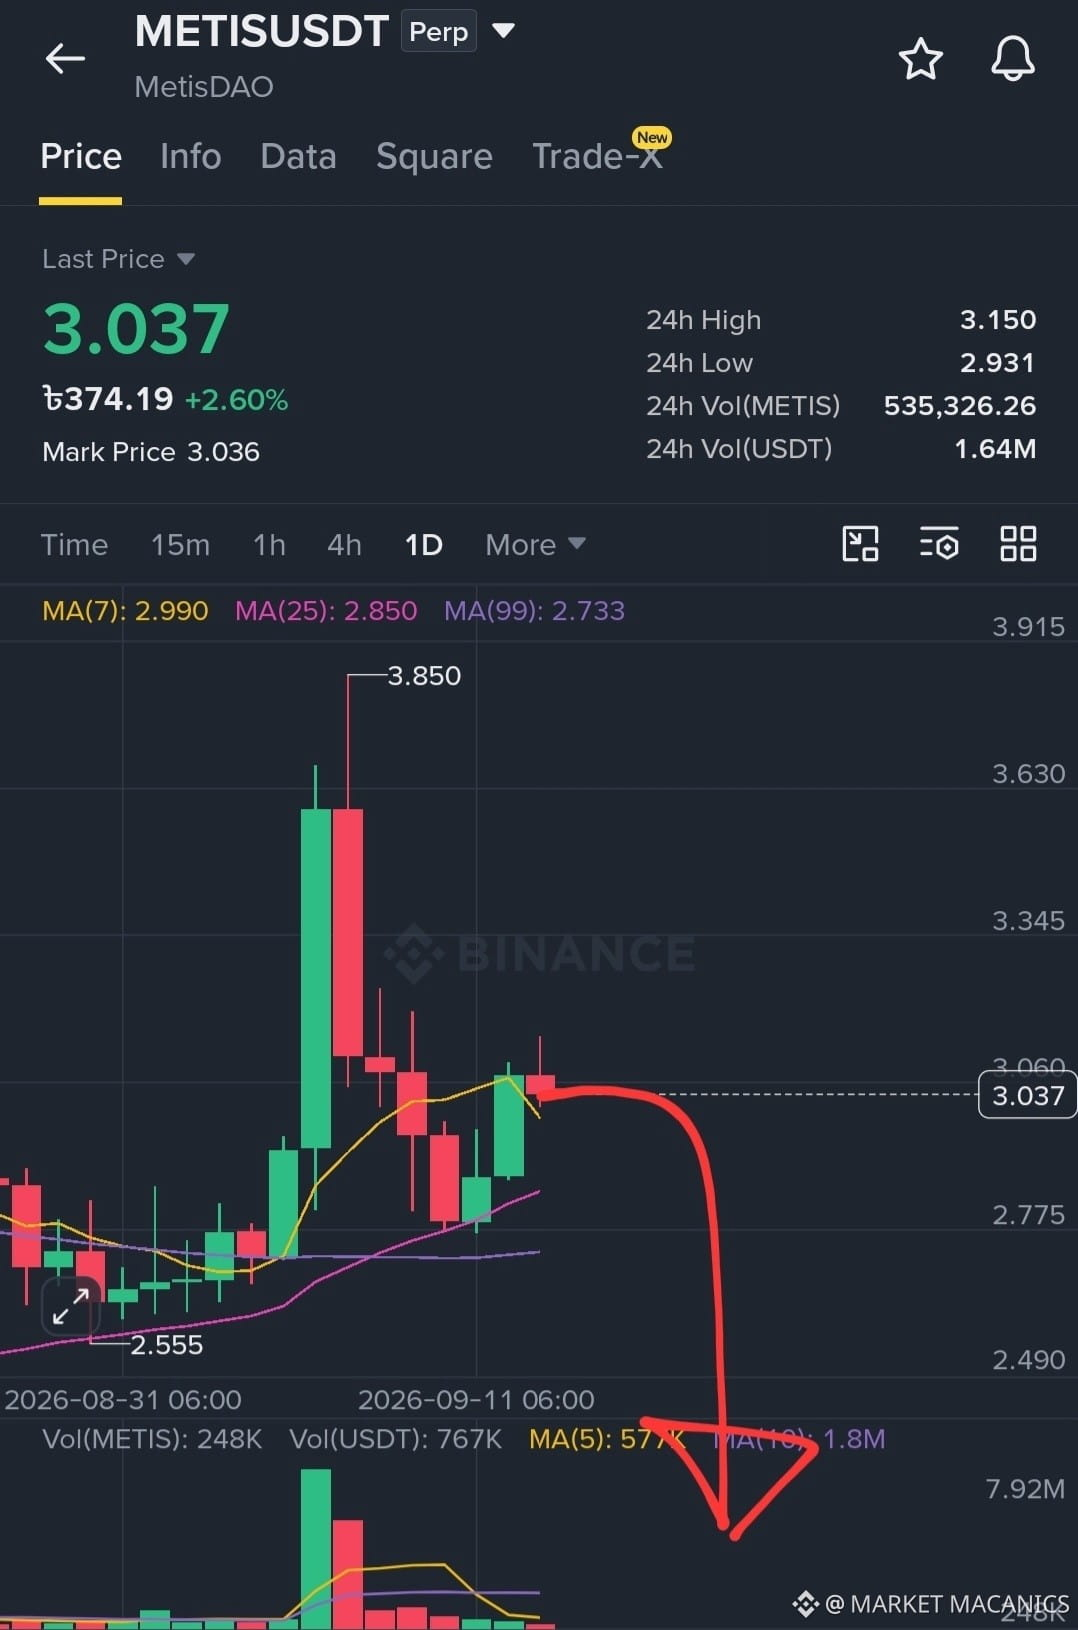
$METIS METIS Bearish Market: Sellers Pressure Key Support 📉
The METIS chart is showing a bearish market structure, suggesting that sellers are maintaining pressure while buyers struggle to regain control. 📉 Repeated rejection from resistance, weaker rebounds, and lower highs can indicate that bullish momentum is fading. When price consistently fails to reclaim important levels, recovery attempts may become opportunities for sellers to enter. This keeps the risk of further downside elevated while the broader structure remains below key resistance.
For an actionable short setup, traders should wait for confirmation instead of entering simply because the market appears weak. A potential short entry can be considered after METIS decisively breaks an established support level with strong selling volume. 🔻 An even stronger trigger is a breakdown followed by a failed retest, where former support turns into resistance. If price rejects that level and continues lower, the bearish setup gains clearer confirmation.
Once the breakdown is confirmed, traders can structure three downside targets around successive support and demand zones. 🎯 Target 1 should be the nearest meaningful support below the breakdown. Target 2 can focus on the next established demand area, while Target 3 can target a deeper historical support zone if bearish momentum accelerates. Taking partial profits at each target can secure gains progressively while leaving some exposure open for a potentially larger decline.
Risk management remains essential because METIS can produce sharp countertrend rallies even during a bearish trend. ⚠️ A stop-loss can generally be placed above the failed-retest zone or the latest significant lower high. If METIS reclaims the broken support and begins forming higher highs, the bearish thesis becomes weaker or invalid. Traders should also avoid excessive leverage and keep position size appropriate for market volatility.
$STEEM
$LSK
The METIS chart is showing a bearish market structure, suggesting that sellers are maintaining pressure while buyers struggle to regain control. 📉 Repeated rejection from resistance, weaker rebounds, and lower highs can indicate that bullish momentum is fading. When price consistently fails to reclaim important levels, recovery attempts may become opportunities for sellers to enter. This keeps the risk of further downside elevated while the broader structure remains below key resistance.
For an actionable short setup, traders should wait for confirmation instead of entering simply because the market appears weak. A potential short entry can be considered after METIS decisively breaks an established support level with strong selling volume. 🔻 An even stronger trigger is a breakdown followed by a failed retest, where former support turns into resistance. If price rejects that level and continues lower, the bearish setup gains clearer confirmation.
Once the breakdown is confirmed, traders can structure three downside targets around successive support and demand zones. 🎯 Target 1 should be the nearest meaningful support below the breakdown. Target 2 can focus on the next established demand area, while Target 3 can target a deeper historical support zone if bearish momentum accelerates. Taking partial profits at each target can secure gains progressively while leaving some exposure open for a potentially larger decline.
Risk management remains essential because METIS can produce sharp countertrend rallies even during a bearish trend. ⚠️ A stop-loss can generally be placed above the failed-retest zone or the latest significant lower high. If METIS reclaims the broken support and begins forming higher highs, the bearish thesis becomes weaker or invalid. Traders should also avoid excessive leverage and keep position size appropriate for market volatility.
$STEEM
$LSK