$XAU
🚨Gold technical analysis: Buyers hesitate but no signs of a bearish reversal yet🚨
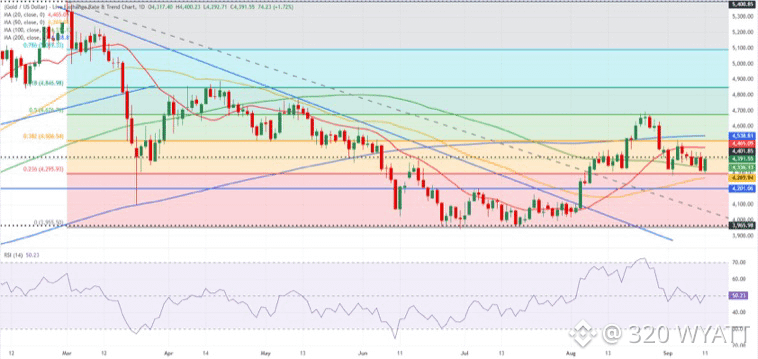
The near-term technical outlook is yet to highlight a buildup in bearish pressure as the Relative Strength Index (RSI) indicator on the daily chart holds steady at around 50 and Gold sits above the 100-day Simple Moving Average (SMA) despite closing below that level on Thursday.
On the upside, $4,510-$4,535 (Fibonacci 38.2% retracement of the March-August downtrend, 200-day SMA) remains intact as a key resistance region. In case Gold stabilizes above this area and confirms it as support, $4,675-$4,700 (Fibonacci 50% retracement, round level) could be seen as the next bullish target before $4,850 (Fibonacci 61.8% retracement).
Looking south, the first important support level could be spotted at $4,330-$4,295 (100-day SMA, static level, Fibonacci 23.6% retracement) ahead of $4,270 (50-day SMA) and $4,200 (static level).
#gold320 #mr320 #Trendingissue #xau #WriteToEarn2026
🚨Gold technical analysis: Buyers hesitate but no signs of a bearish reversal yet🚨
The near-term technical outlook is yet to highlight a buildup in bearish pressure as the Relative Strength Index (RSI) indicator on the daily chart holds steady at around 50 and Gold sits above the 100-day Simple Moving Average (SMA) despite closing below that level on Thursday.
On the upside, $4,510-$4,535 (Fibonacci 38.2% retracement of the March-August downtrend, 200-day SMA) remains intact as a key resistance region. In case Gold stabilizes above this area and confirms it as support, $4,675-$4,700 (Fibonacci 50% retracement, round level) could be seen as the next bullish target before $4,850 (Fibonacci 61.8% retracement).
Looking south, the first important support level could be spotted at $4,330-$4,295 (100-day SMA, static level, Fibonacci 23.6% retracement) ahead of $4,270 (50-day SMA) and $4,200 (static level).
#gold320 #mr320 #Trendingissue #xau #WriteToEarn2026