

$BITCOIN n (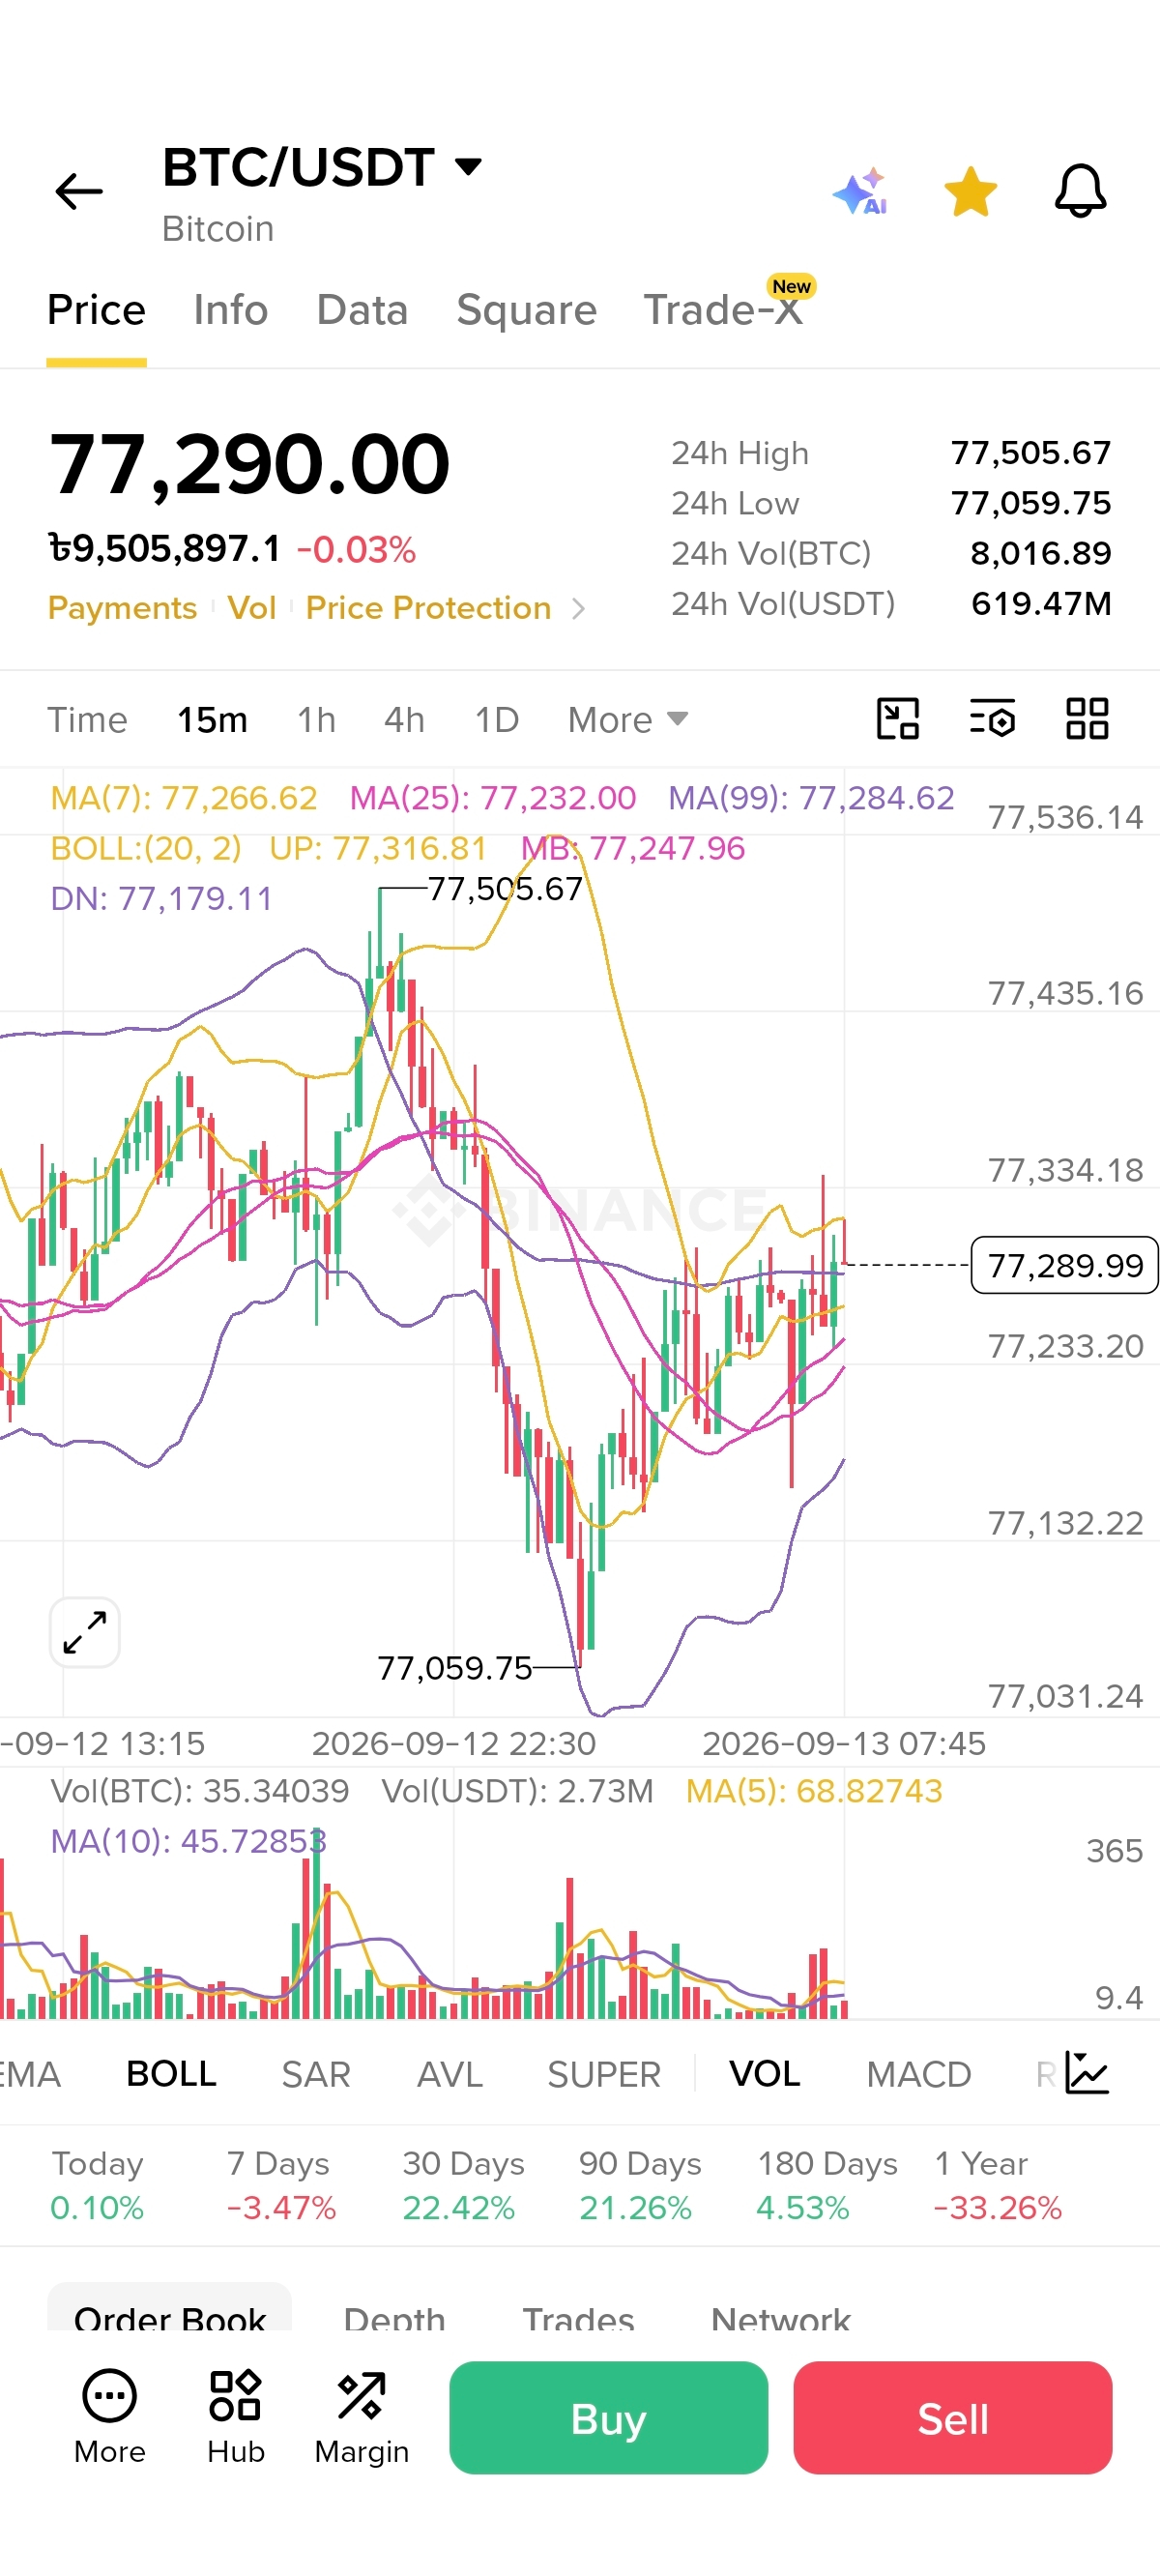 BTC/USDT) is currently trading around $77,290 on the 15-minute chart, showing signs of short-term consolidation after a sharp rebound from the recent low near $77,059.
The chart shows BTC trading close to several key moving averages. MA(7) is around $77,266, MA(25) around $77,232, while MA(99) is near $77,285. This suggests the market is currently in a relatively tight decision zone.
Key Levels to Watch
Resistance:
$77,330–$77,435 — immediate resistance area
$77,505 — recent high and major short-term resistance
A sustained break above $77,505 could strengthen the short-term bullish momentum.
Support:
$77,230–$77,180 — first support zone
$77,130 — additional support
$77,060 — recent low and important downside level
The Bollinger Bands also show that BTC is trading around the middle band, meaning the market is currently lacking a strong directional move.
Market Outlook
For the short term, BTC appears to be range-bound with a slight recovery bias, but confirmation is still needed. A breakout above $77,505 could open the door for further upside, while a breakdown below $77,180–$77,060 could bring renewed selling pressure.
Conclusion:
BTC is currently at a critical decision point. Rather than chasing the price, traders may want to wait for a confirmed breakout or breakdown and then assess the next move.