Everyone is watching the daily bullish trend, but the 1h tape is screaming something different.
$BTC /USDT - 🟢 SHORT · Conf 78%
Trade Plan:
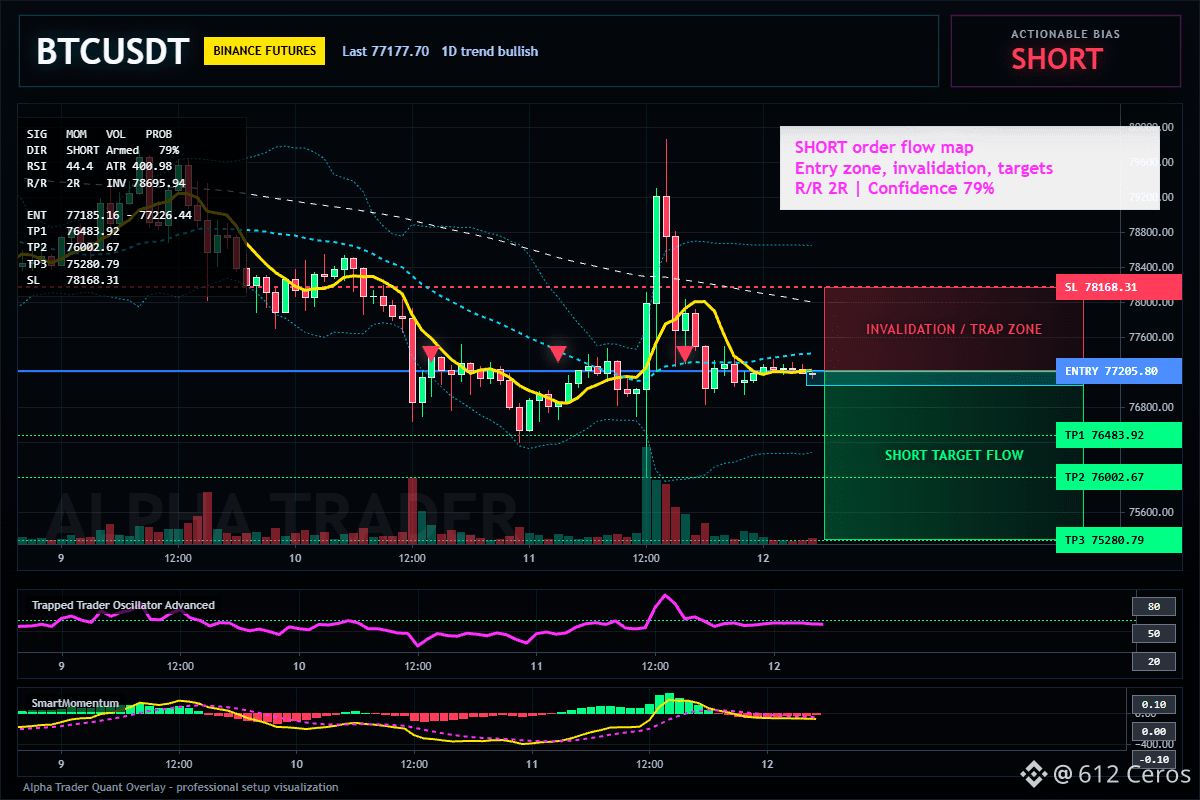
Entry: 77185.16 – 77226.44
SL: 78168.31
TP1: 76483.92
TP2: 76002.67
TP3: 75280.79
Why this setup?
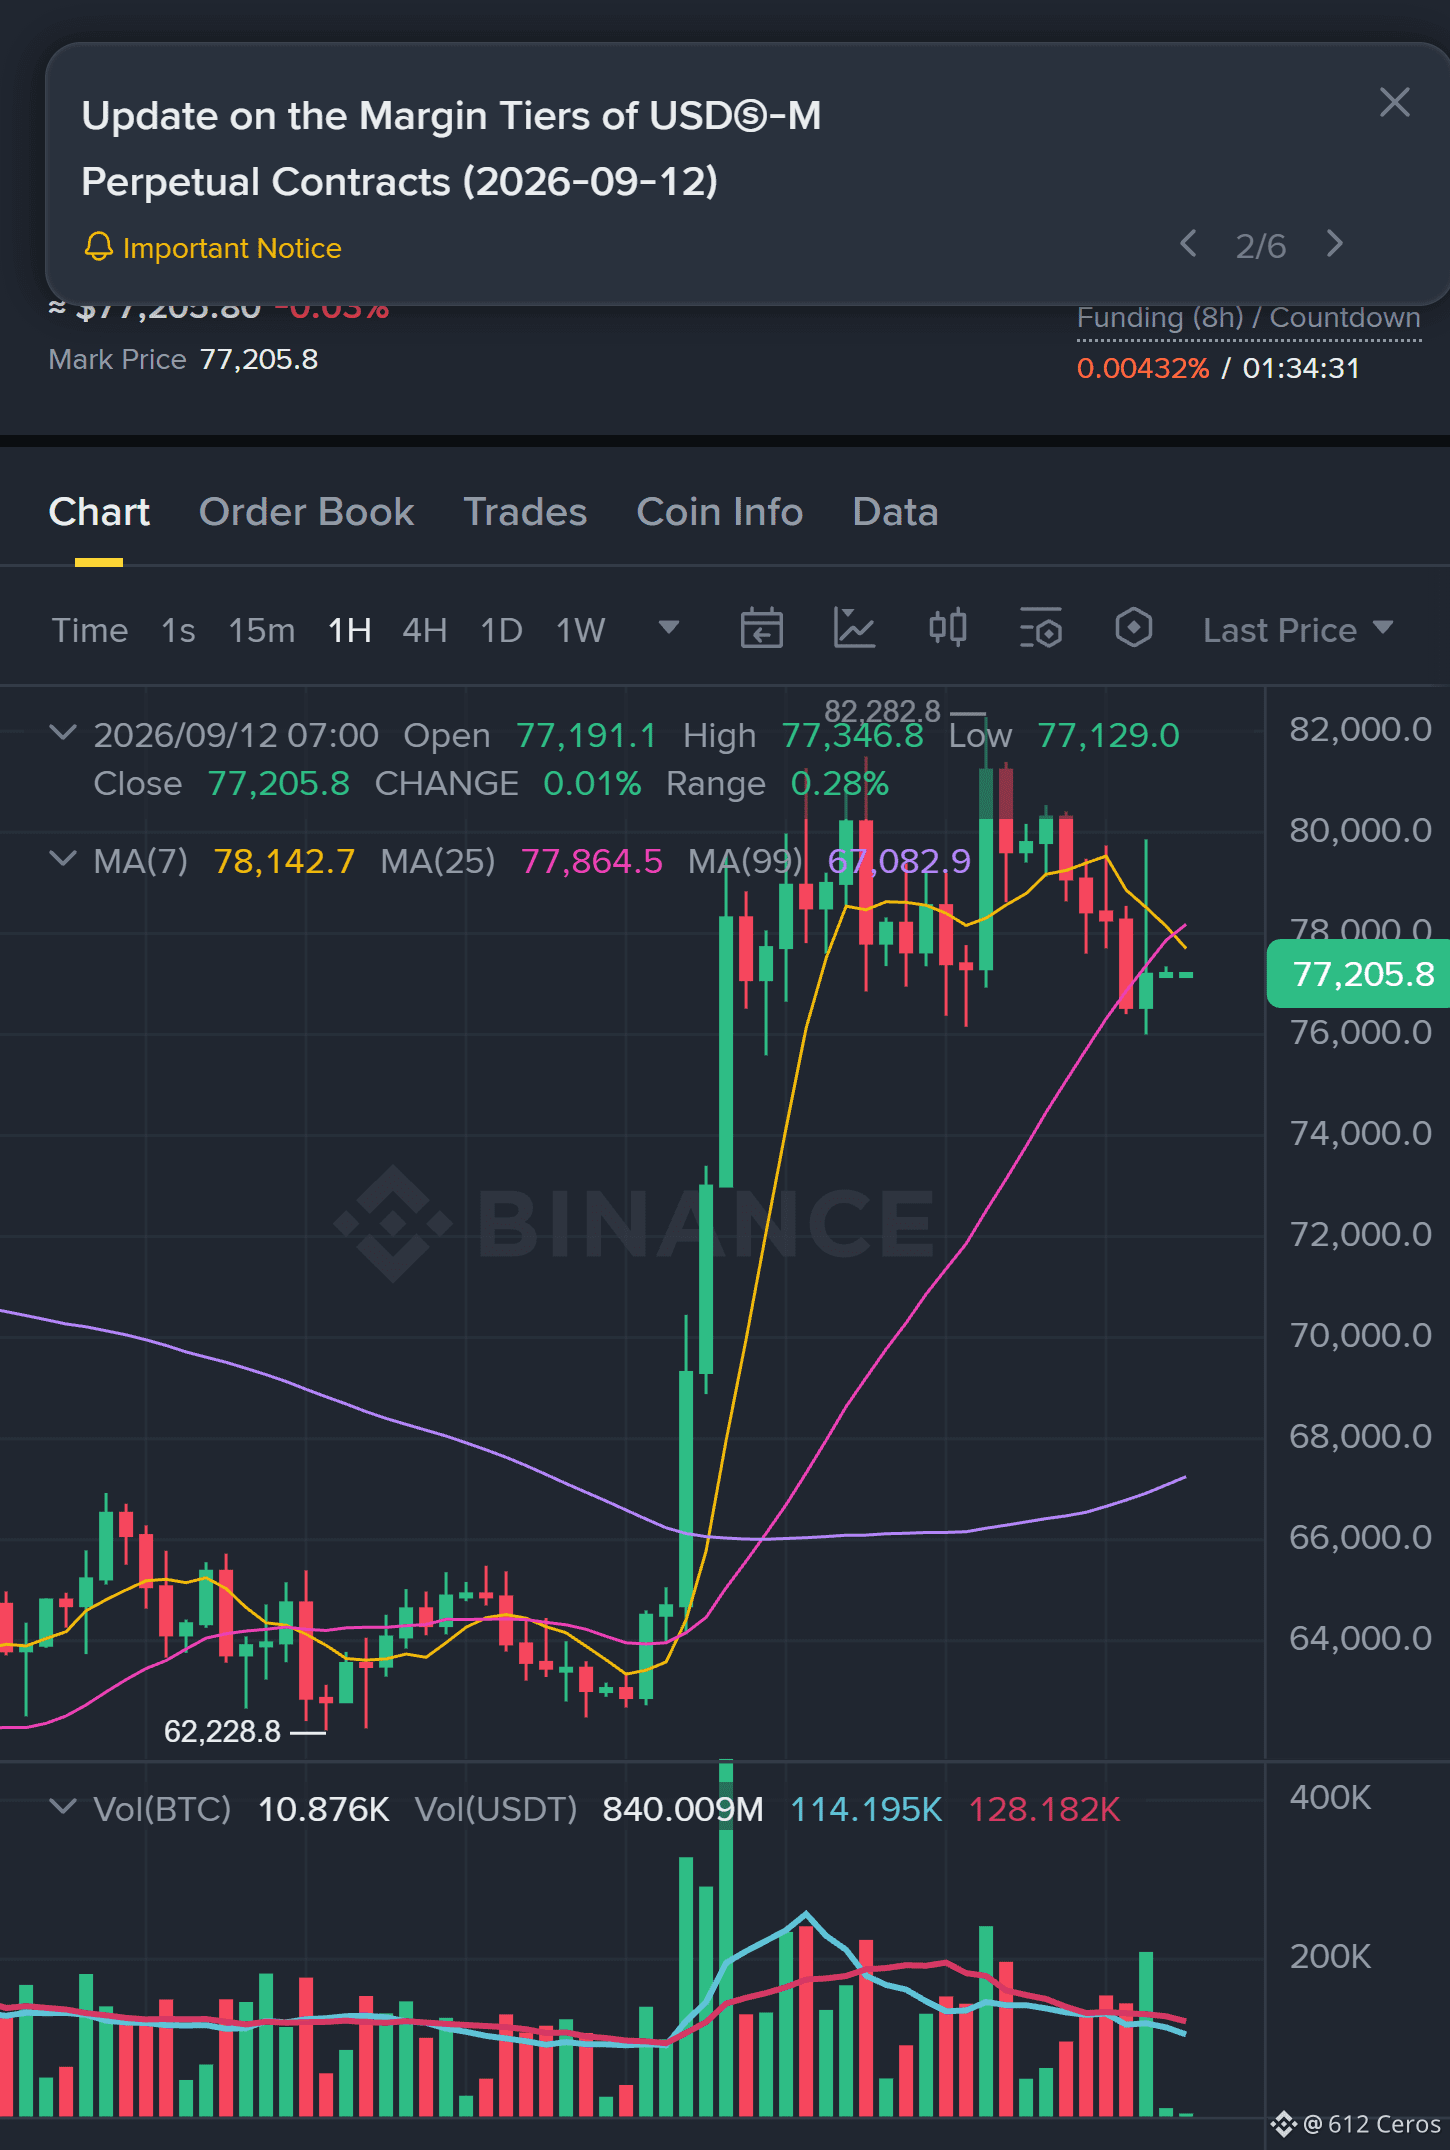
Why now? The 1h price is sitting at 77205.80, which is the exact entry_ref, and the 15m RSI at 44.43 shows momentum is already fading before we even get a bounce. The 1h ATR of 400.98 means this asset moves nearly 400 dollars every hour, so the entry zone between 77185.16 and 77226.44 is a narrow corridor where a short can catch the next wave. The daily trend is still bullish, which makes this a counter-trend bet against the higher timeframe, meaning this is a higher risk reversal setup that requires smaller size and strict respect for the stop. The invalidation level is 78695.94, and that is the hard line in the sand that proves this entire directional thesis wrong.
Debate:
Are we testing the 78695.94 invalidation or is this short heading straight to TP2?
Click here to view the chart 👇️
⚠️ Personal market analysis only. NFA — manage risk and DYOR.
Educational content, not investment advice or a recommendation to buy, sell, deposit, or withdraw any asset. No paid promotion or referral/affiliate links.
$BTC /USDT - 🟢 SHORT · Conf 78%
Trade Plan:
Entry: 77185.16 – 77226.44
SL: 78168.31
TP1: 76483.92
TP2: 76002.67
TP3: 75280.79
Why this setup?
Why now? The 1h price is sitting at 77205.80, which is the exact entry_ref, and the 15m RSI at 44.43 shows momentum is already fading before we even get a bounce. The 1h ATR of 400.98 means this asset moves nearly 400 dollars every hour, so the entry zone between 77185.16 and 77226.44 is a narrow corridor where a short can catch the next wave. The daily trend is still bullish, which makes this a counter-trend bet against the higher timeframe, meaning this is a higher risk reversal setup that requires smaller size and strict respect for the stop. The invalidation level is 78695.94, and that is the hard line in the sand that proves this entire directional thesis wrong.
Debate:
Are we testing the 78695.94 invalidation or is this short heading straight to TP2?
Click here to view the chart 👇️
⚠️ Personal market analysis only. NFA — manage risk and DYOR.
Educational content, not investment advice or a recommendation to buy, sell, deposit, or withdraw any asset. No paid promotion or referral/affiliate links.