Ethereum Sends a Cautious Message to Investors
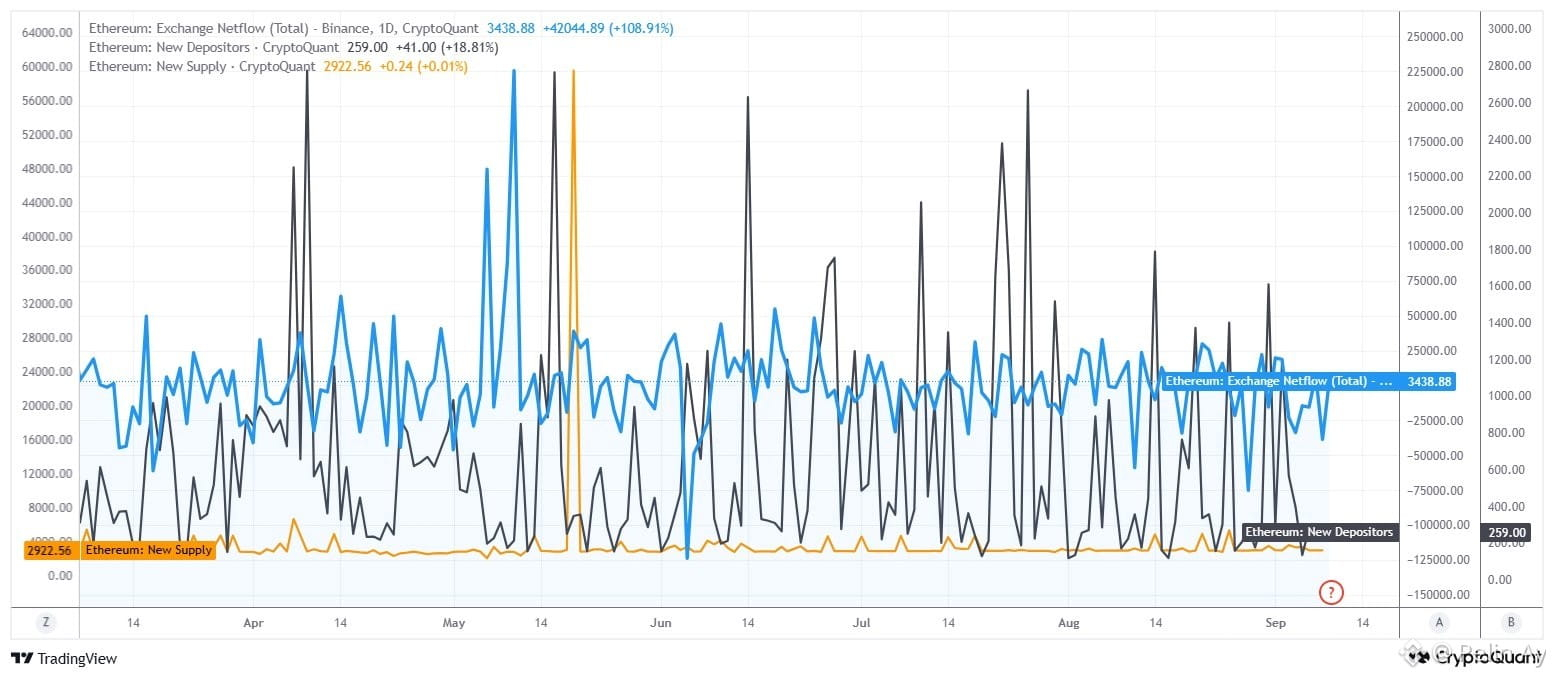
The chart shows Binance Netflow is approximately +3,439 ETH. This isn't a massive inflow in absolute terms; however, the strong positive daily change indicates a significant increase in the amount of ETH flowing into Binance that day compared to the previous day. The blue line across the chart mostly fluctuates sharply around zero. This suggests a volatile environment influenced by regular one-way short-term transfers and large player movements.
A single day of positive netflow is often not a reliable sell signal. These transfers could be staking, collateral, arbitrage, or internal wallet arrangements. Several consecutive days of high positive netflow are needed for the signal to strengthen.
New depositors, on the other hand, are at 259, showing an increase of approximately 18.8% during the day. Reading this data together with netflow:
New depositors have extreme jumps from time to time, but these don't form a sustained uptrend. The recent 259 level is lower than its past highs. Therefore, it wouldn't be accurate to conclude that a large sell-off is currently underway.
The new supply is approximately 2,922 ETH and remains virtually unchanged. The horizontal line indicates there hasn't been a sudden expansion in the newly created ETH supply.
This alone isn't a bullish signal; however, it does suggest there isn't an additional, structural supply shock that would trigger selling pressure. Especially if exchange netflow also turns negative over time, the combination of stable supply and withdrawals from exchanges becomes supportive of the price.
In my opinion, this data warrants caution in the short term; ETH may encounter selling pressure during upward attempts or may experience a sideways-downward movement. However, since the number of new depositors remains low, this chart alone doesn't strongly support a bearish outlook. $ETH #Ethereum #Binance
The chart shows Binance Netflow is approximately +3,439 ETH. This isn't a massive inflow in absolute terms; however, the strong positive daily change indicates a significant increase in the amount of ETH flowing into Binance that day compared to the previous day. The blue line across the chart mostly fluctuates sharply around zero. This suggests a volatile environment influenced by regular one-way short-term transfers and large player movements.
A single day of positive netflow is often not a reliable sell signal. These transfers could be staking, collateral, arbitrage, or internal wallet arrangements. Several consecutive days of high positive netflow are needed for the signal to strengthen.
New depositors, on the other hand, are at 259, showing an increase of approximately 18.8% during the day. Reading this data together with netflow:
New depositors have extreme jumps from time to time, but these don't form a sustained uptrend. The recent 259 level is lower than its past highs. Therefore, it wouldn't be accurate to conclude that a large sell-off is currently underway.
The new supply is approximately 2,922 ETH and remains virtually unchanged. The horizontal line indicates there hasn't been a sudden expansion in the newly created ETH supply.
This alone isn't a bullish signal; however, it does suggest there isn't an additional, structural supply shock that would trigger selling pressure. Especially if exchange netflow also turns negative over time, the combination of stable supply and withdrawals from exchanges becomes supportive of the price.
In my opinion, this data warrants caution in the short term; ETH may encounter selling pressure during upward attempts or may experience a sideways-downward movement. However, since the number of new depositors remains low, this chart alone doesn't strongly support a bearish outlook. $ETH #Ethereum #Binance