📊 Bitcoin Price Analysis: BTC Enters a Key Decision Zone
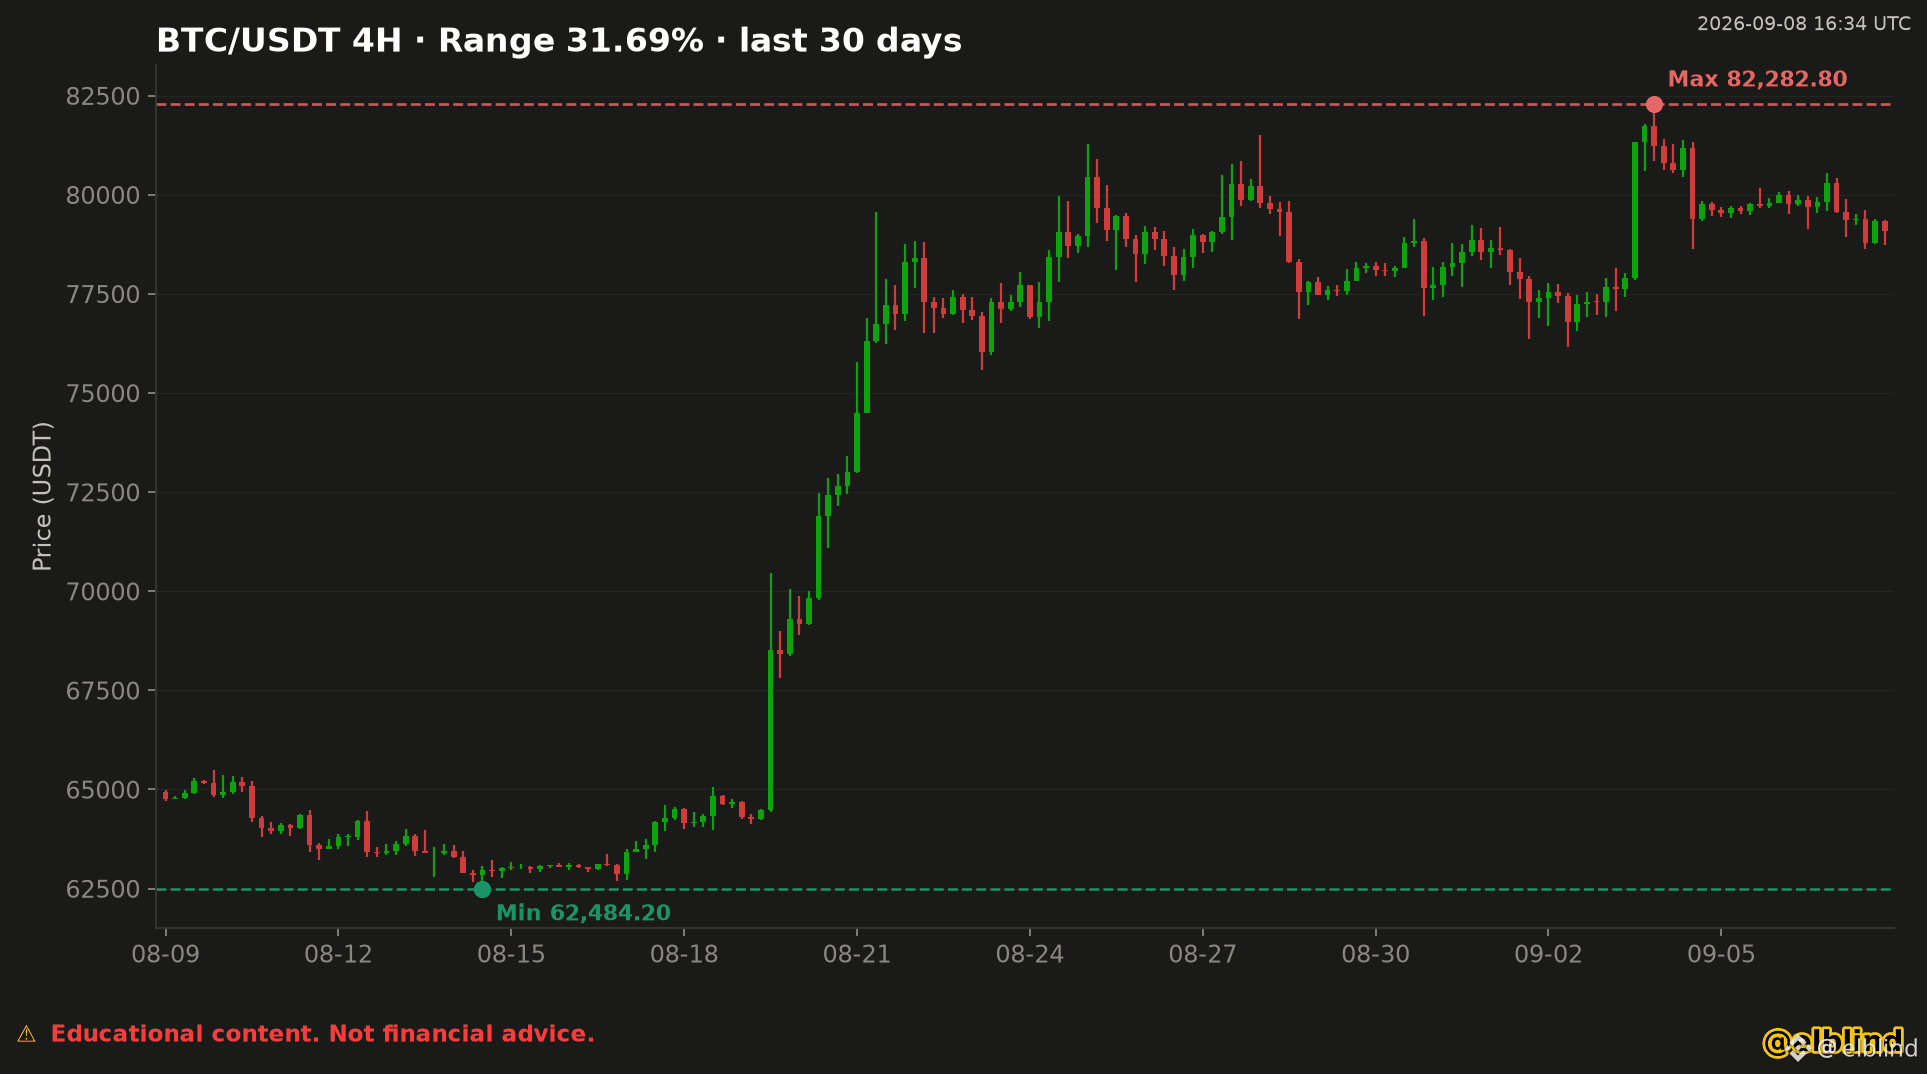
Over the last 30 days, BTC/USDT has traded between $62,484.20 and $82,282.80—a low-to-high range of 31.69%, or nearly $19,800.
After forming its monthly low in mid-August, $BTC produced an explosive breakout and established a clear sequence of higher highs and higher lows. The broader 4-hour structure remains bullish, but short-term momentum has cooled.
Bitcoin was rejected near $82,283 and is now consolidating around $79,000, roughly 4% below the monthly high. Buyers are still defending the upper part of the range, although repeated failures around $80,000 show that selling pressure remains active.
Key BTC levels:
🔴 Resistance: $80,000, followed by $82,283
🟢 Support: $77,000–$77,500
🟢 Deeper support: approximately $75,000
A confirmed 4-hour close above $82,283 could restart the bullish expansion. Holding above $77,000 would preserve the current market structure, while a breakdown below that zone could trigger a deeper correction toward $75,000.
Important: the 31.69% figure measures the distance between the 30-day low and high. It is not Bitcoin’s net monthly return.
Does Bitcoin break $82K next, or retest support first?
Like this post, share your BTC target in the comments and follow @elblind for more data-driven Bitcoin market analysis.
Past performance does not guarantee future results.
⚠️ Educational content only. Not financial advice.
#Bitcoin #BTC #BTCUSDT #BitcoinAnalysis #CryptoTrading
Over the last 30 days, BTC/USDT has traded between $62,484.20 and $82,282.80—a low-to-high range of 31.69%, or nearly $19,800.
After forming its monthly low in mid-August, $BTC produced an explosive breakout and established a clear sequence of higher highs and higher lows. The broader 4-hour structure remains bullish, but short-term momentum has cooled.
Bitcoin was rejected near $82,283 and is now consolidating around $79,000, roughly 4% below the monthly high. Buyers are still defending the upper part of the range, although repeated failures around $80,000 show that selling pressure remains active.
Key BTC levels:
🔴 Resistance: $80,000, followed by $82,283
🟢 Support: $77,000–$77,500
🟢 Deeper support: approximately $75,000
A confirmed 4-hour close above $82,283 could restart the bullish expansion. Holding above $77,000 would preserve the current market structure, while a breakdown below that zone could trigger a deeper correction toward $75,000.
Important: the 31.69% figure measures the distance between the 30-day low and high. It is not Bitcoin’s net monthly return.
Does Bitcoin break $82K next, or retest support first?
Like this post, share your BTC target in the comments and follow @elblind for more data-driven Bitcoin market analysis.
Past performance does not guarantee future results.
⚠️ Educational content only. Not financial advice.
#Bitcoin #BTC #BTCUSDT #BitcoinAnalysis #CryptoTrading