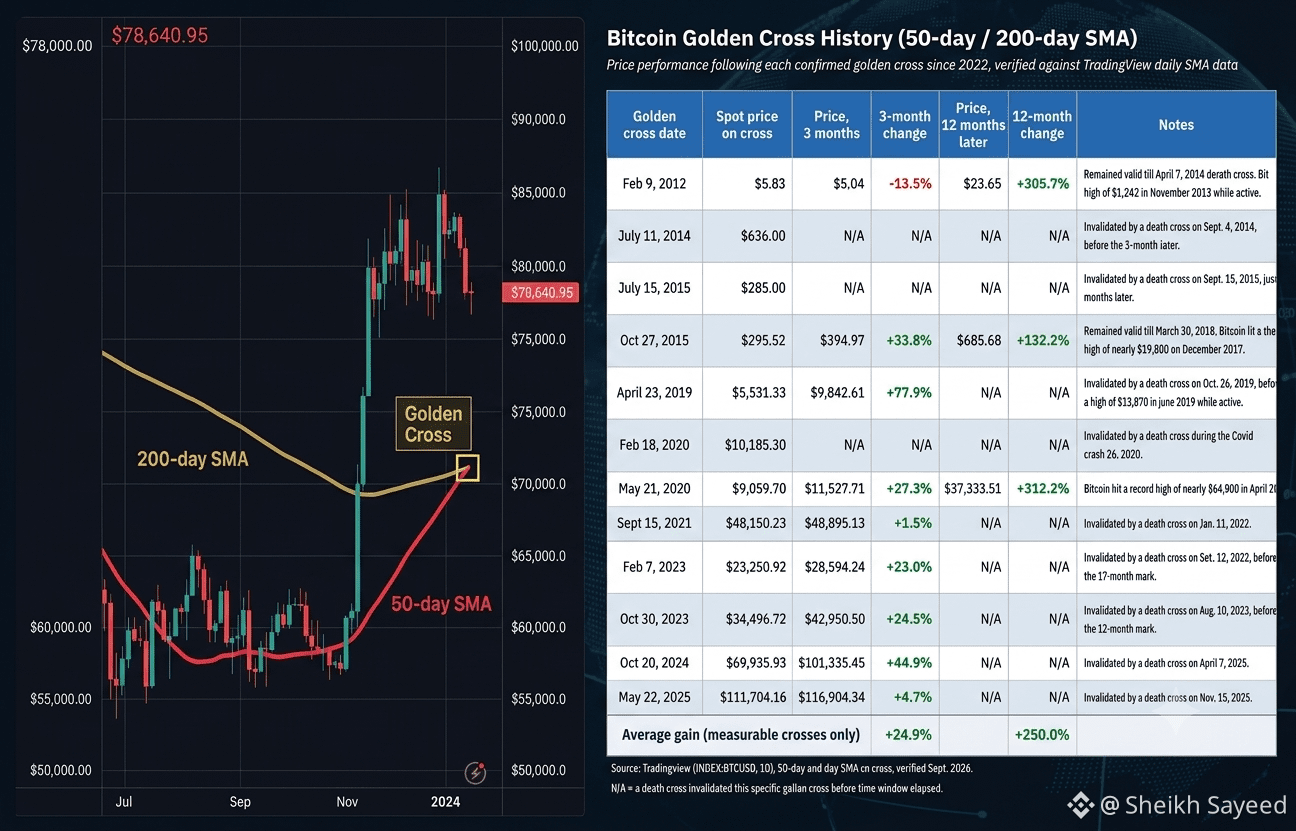
$BTC 50/200 SMA Golden Cross just triggered around $78.6k.
Before jumping in blind, let’s look at what the actual backtest data tells us:
1. The Hard Numbers
12 Historic Crosses: 9 ended up as bull traps (invalidated by a death cross before month 12). That's a 75% failure rate for long-term expansion.
3-Month Expectation: Average return sits at +24.9% across measurable windows. Green, but not vertical.
The Tail Risk (The 25% Winner): When the macro aligns and it holds for a full year (2012, 2015, 2020), the average return hits +250%.
2. Technical Reality
The Golden Cross is a lagging status check, not an entry trigger. By the time the 50 SMA crosses the 200 SMA, the explosive phase of the initial leg up has already played out.
Chasing market buys on the crossover moment historically gets traders trapped near localized resistance ($80.5k rejection).
3. Execution Plan
Don't buy the cross blindly. Wait for dynamic support to prove itself.
Key Watch: Look for price to pull back and consolidate over the 50-day SMA, paired with strong spot order flow (ETF/net inflows) rather than pure leverage-driven open interest.
Support to Hold: Keeping $78k intact as structural demand is priority #1. A loss here points back toward the $74k-$77k zone.
Respect the macro trend, but manage your risk—don't let a lagging indicator make your execution sloppy.
Are you playing the pullback or staying on the sidelines until $80.5k breaks clean? Let's hear your plan 👇
#BTC #Crypto #TechnicalAnalysis #BinanceSquare #TradingStrategy
Before jumping in blind, let’s look at what the actual backtest data tells us:
1. The Hard Numbers
12 Historic Crosses: 9 ended up as bull traps (invalidated by a death cross before month 12). That's a 75% failure rate for long-term expansion.
3-Month Expectation: Average return sits at +24.9% across measurable windows. Green, but not vertical.
The Tail Risk (The 25% Winner): When the macro aligns and it holds for a full year (2012, 2015, 2020), the average return hits +250%.
2. Technical Reality
The Golden Cross is a lagging status check, not an entry trigger. By the time the 50 SMA crosses the 200 SMA, the explosive phase of the initial leg up has already played out.
Chasing market buys on the crossover moment historically gets traders trapped near localized resistance ($80.5k rejection).
3. Execution Plan
Don't buy the cross blindly. Wait for dynamic support to prove itself.
Key Watch: Look for price to pull back and consolidate over the 50-day SMA, paired with strong spot order flow (ETF/net inflows) rather than pure leverage-driven open interest.
Support to Hold: Keeping $78k intact as structural demand is priority #1. A loss here points back toward the $74k-$77k zone.
Respect the macro trend, but manage your risk—don't let a lagging indicator make your execution sloppy.
Are you playing the pullback or staying on the sidelines until $80.5k breaks clean? Let's hear your plan 👇
#BTC #Crypto #TechnicalAnalysis #BinanceSquare #TradingStrategy