The most dangerous chart setups aren't the ones falling off a cliff—they’re the ones slowly grinding higher while overhead supply compresses the candles.
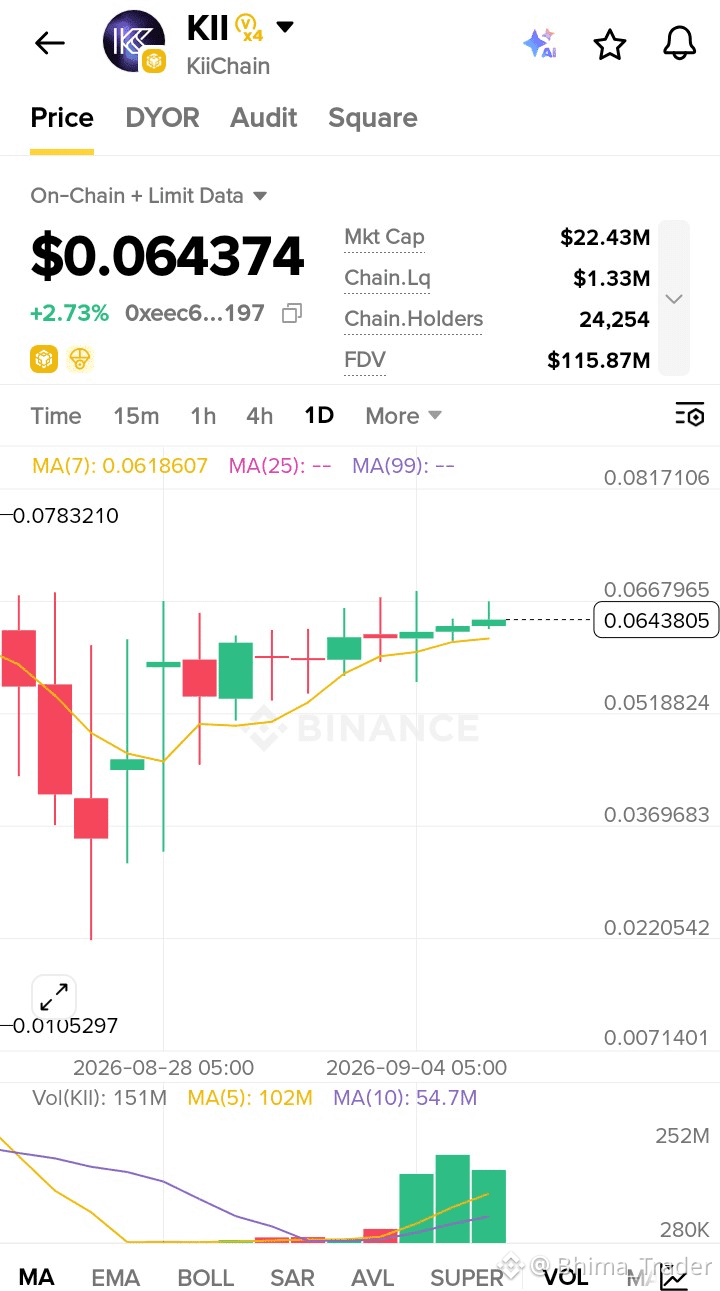
Look at how KII recovered from its extreme low near 0.0105. At first, the daily range was wide and volatile. But as price pushed back toward the 0.064 zone, the green candle bodies started shrinking while leaving persistent wicks above 0.066.
That tightening price action right at local resistance signals a clear shift in market dynamics. Buyers are steadily defending higher lows along the MA7, but every attempt to expand higher is meeting immediate limit orders. The volume remains elevated compared to the base, yet price progress is slowing down.
This isn't a guaranteed breakdown, nor is it an explosive breakout yet. It's a volatility squeeze where the market is deciding whether buyers have enough spot demand to absorb the remaining overhead supply.
The trade isn't in guessing the breakout ahead of time. The real confirmation comes if price can print a decisive daily close above 0.067 with expanding volume—or if a loss of the MA7 triggers a rapid drop to clear out late longs who bought the top of this range.
$KII $BTC
Look at how KII recovered from its extreme low near 0.0105. At first, the daily range was wide and volatile. But as price pushed back toward the 0.064 zone, the green candle bodies started shrinking while leaving persistent wicks above 0.066.
That tightening price action right at local resistance signals a clear shift in market dynamics. Buyers are steadily defending higher lows along the MA7, but every attempt to expand higher is meeting immediate limit orders. The volume remains elevated compared to the base, yet price progress is slowing down.
This isn't a guaranteed breakdown, nor is it an explosive breakout yet. It's a volatility squeeze where the market is deciding whether buyers have enough spot demand to absorb the remaining overhead supply.
The trade isn't in guessing the breakout ahead of time. The real confirmation comes if price can print a decisive daily close above 0.067 with expanding volume—or if a loss of the MA7 triggers a rapid drop to clear out late longs who bought the top of this range.
$KII $BTC