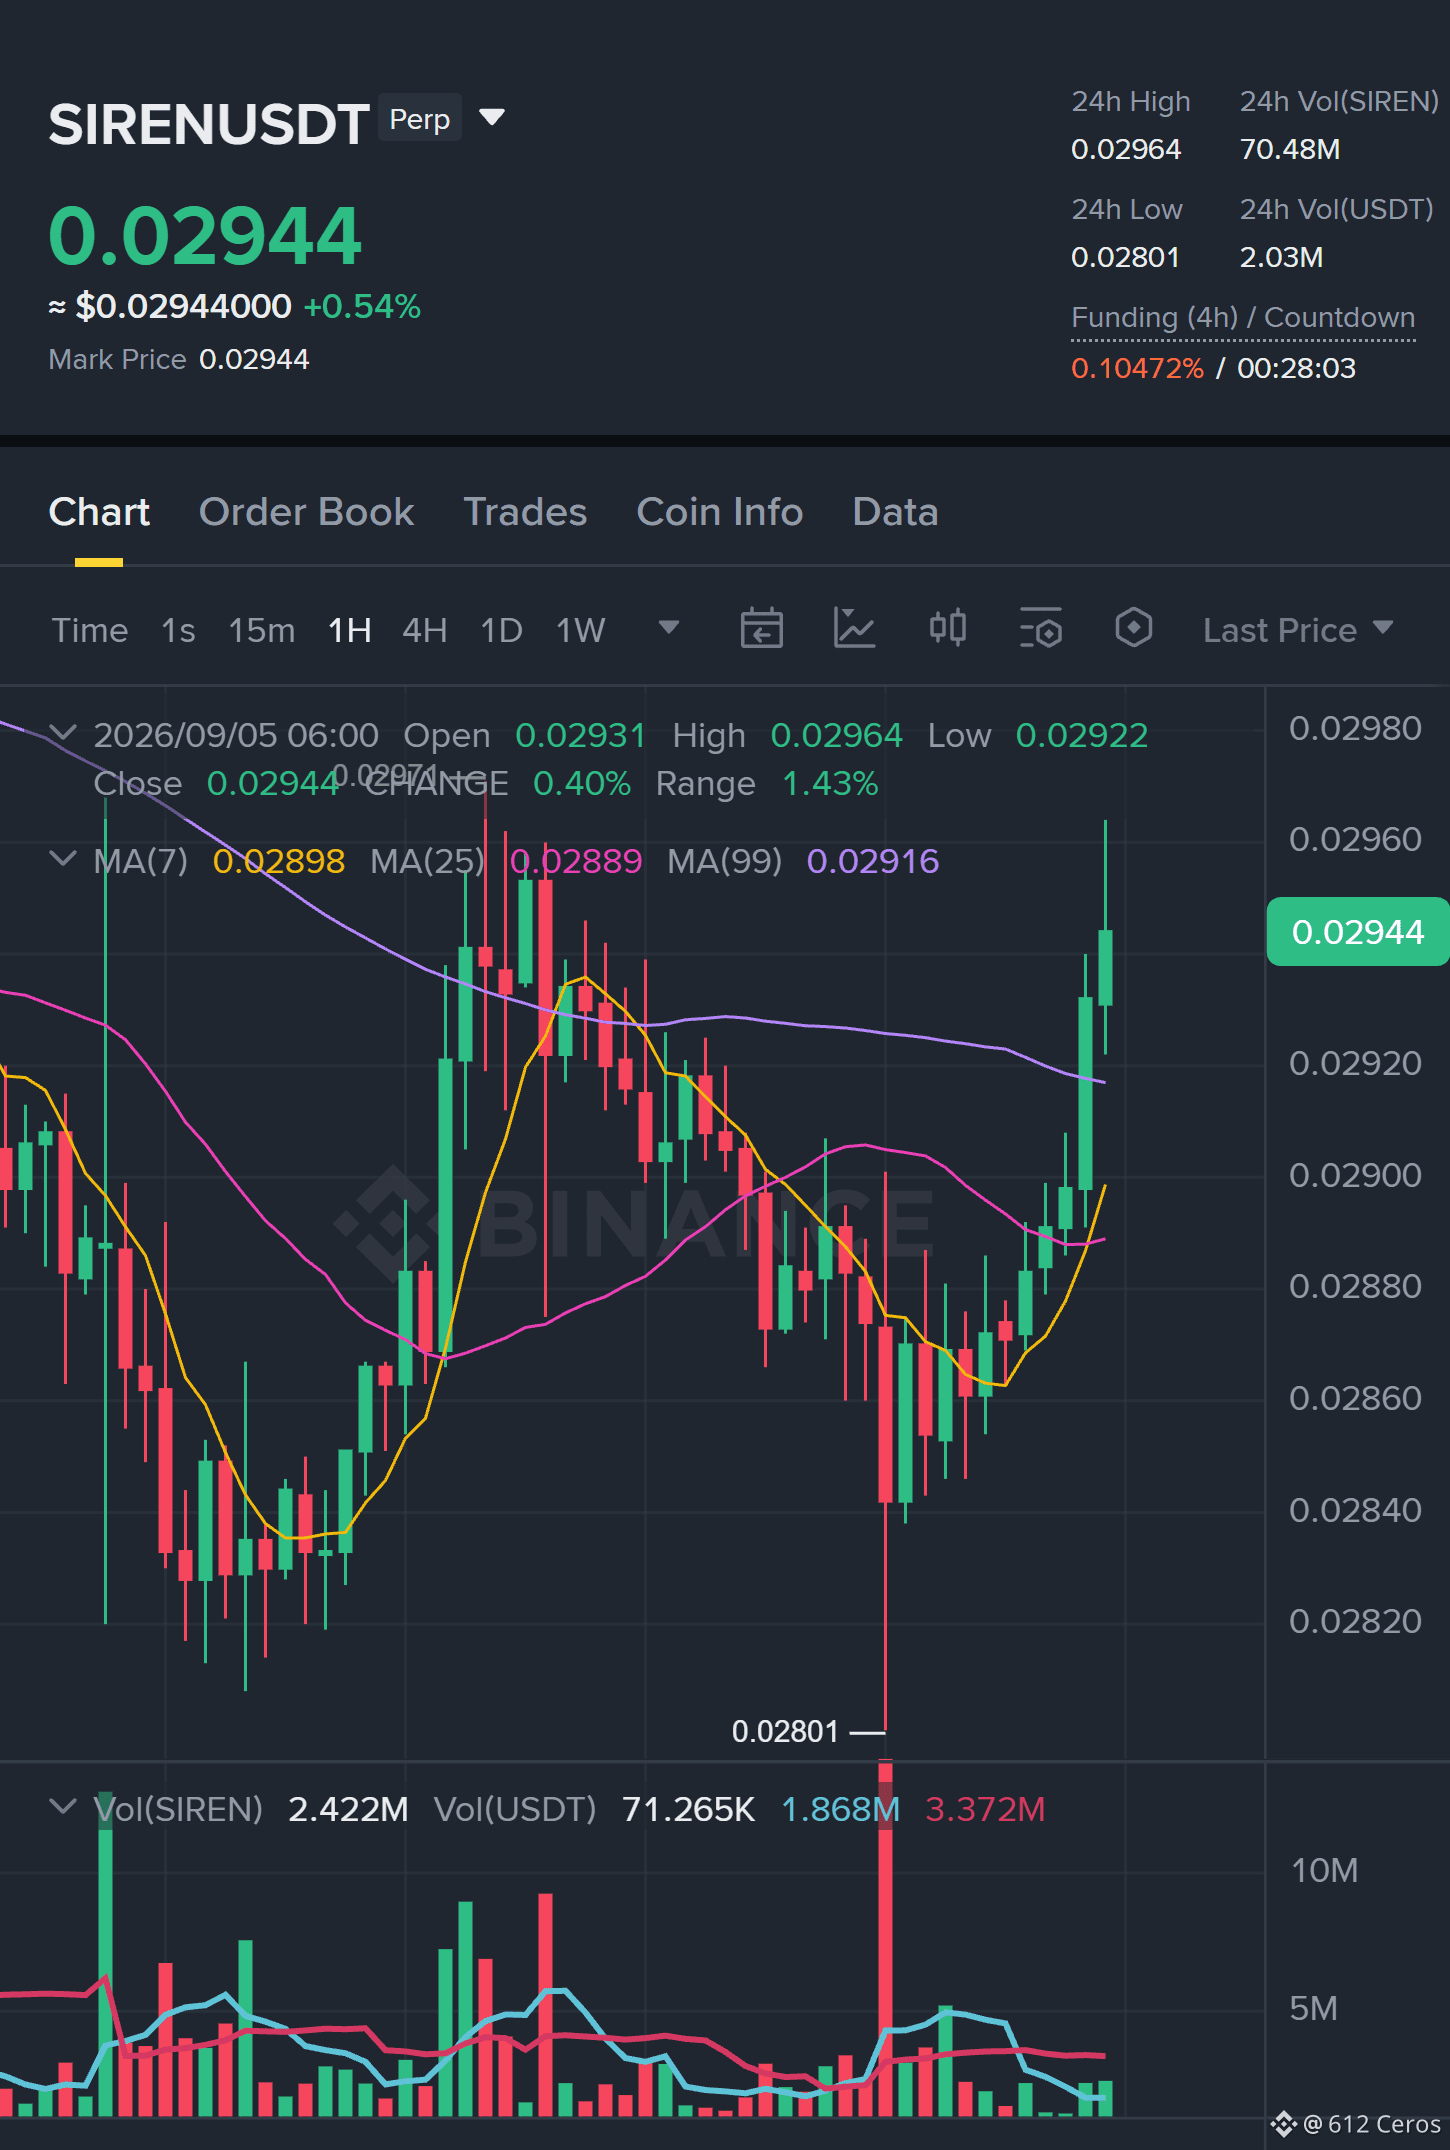
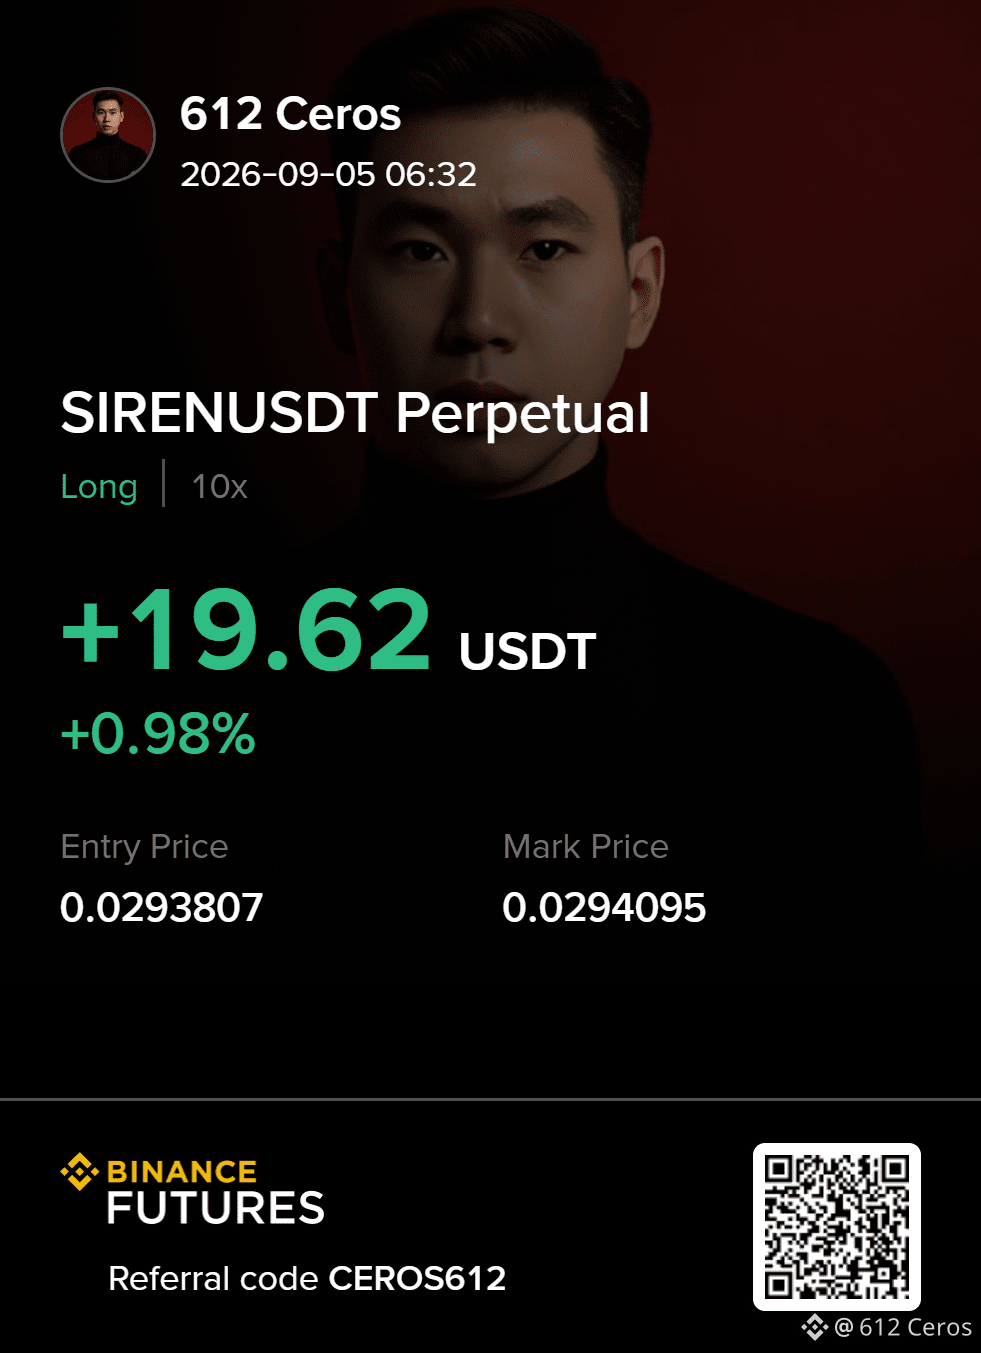
Everyone is staring at the daily bearish chart while the 4H quietly flips the script on $SIREN /USDT.
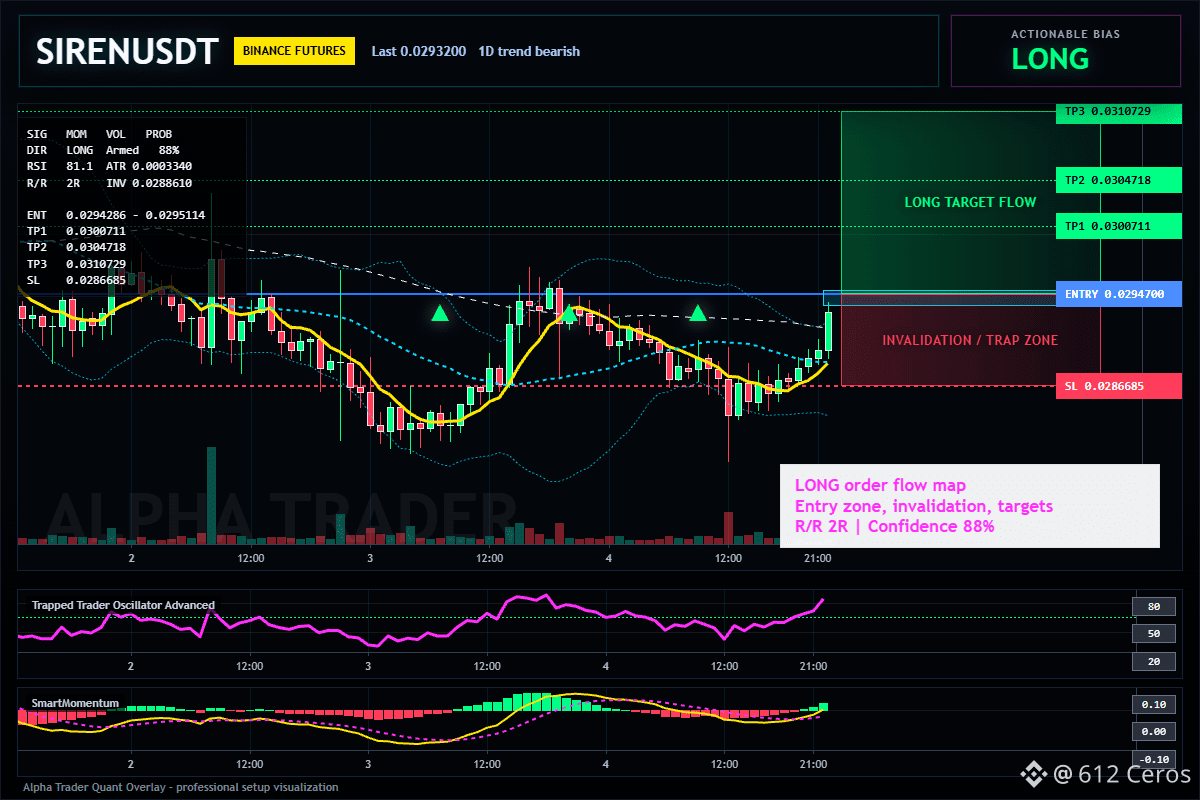
$SIREN - 🟢 LONG · Conf 88%
Trade Plan:
Entry: 0.0294286 – 0.0295114
SL: 0.0286685
TP1: 0.0300711
TP2: 0.0304718
TP3: 0.0310729
Why this setup?
- The 1D trend is bearish, but the 4H momentum is overriding that narrative right now. Price is holding above the 0.0294700 reference with an 88% confidence score backing the long side.
- Why now? The 15m RSI is at 81.08, which screams overheated, but in a strong trend regime, that heat often precedes a squeeze higher rather than an immediate reversal. The ATR on 1H (0.000334) shows volatility is compressing, setting up for an expansion move.
- Targets are stacked: TP1 at 0.0300711, TP2 at 0.0304718, TP3 at 0.0310729. The invalidation line is clear at 0.0286685, giving you a defined risk of roughly 2.7% against a potential 5.4% move to TP3.
- This is a trend-following setup, so the higher-timeframe bearish bias is on notice, but the 4H structure is the one currently in control. Respect the levels, don't fight the data.
Debate:
If the 15m RSI stays pinned above 80 for the next two candles, do you think we gap straight through TP1 or does the daily seller step in first?
Click here to view the chart 👇️
⚠️ Personal market analysis only. NFA — manage risk and DYOR.
Educational content, not investment advice or a recommendation to buy, sell, deposit, or withdraw any asset. No paid promotion or referral/affiliate links.
$SIREN - 🟢 LONG · Conf 88%
Trade Plan:
Entry: 0.0294286 – 0.0295114
SL: 0.0286685
TP1: 0.0300711
TP2: 0.0304718
TP3: 0.0310729
Why this setup?
- The 1D trend is bearish, but the 4H momentum is overriding that narrative right now. Price is holding above the 0.0294700 reference with an 88% confidence score backing the long side.
- Why now? The 15m RSI is at 81.08, which screams overheated, but in a strong trend regime, that heat often precedes a squeeze higher rather than an immediate reversal. The ATR on 1H (0.000334) shows volatility is compressing, setting up for an expansion move.
- Targets are stacked: TP1 at 0.0300711, TP2 at 0.0304718, TP3 at 0.0310729. The invalidation line is clear at 0.0286685, giving you a defined risk of roughly 2.7% against a potential 5.4% move to TP3.
- This is a trend-following setup, so the higher-timeframe bearish bias is on notice, but the 4H structure is the one currently in control. Respect the levels, don't fight the data.
Debate:
If the 15m RSI stays pinned above 80 for the next two candles, do you think we gap straight through TP1 or does the daily seller step in first?
Click here to view the chart 👇️
⚠️ Personal market analysis only. NFA — manage risk and DYOR.
Educational content, not investment advice or a recommendation to buy, sell, deposit, or withdraw any asset. No paid promotion or referral/affiliate links.