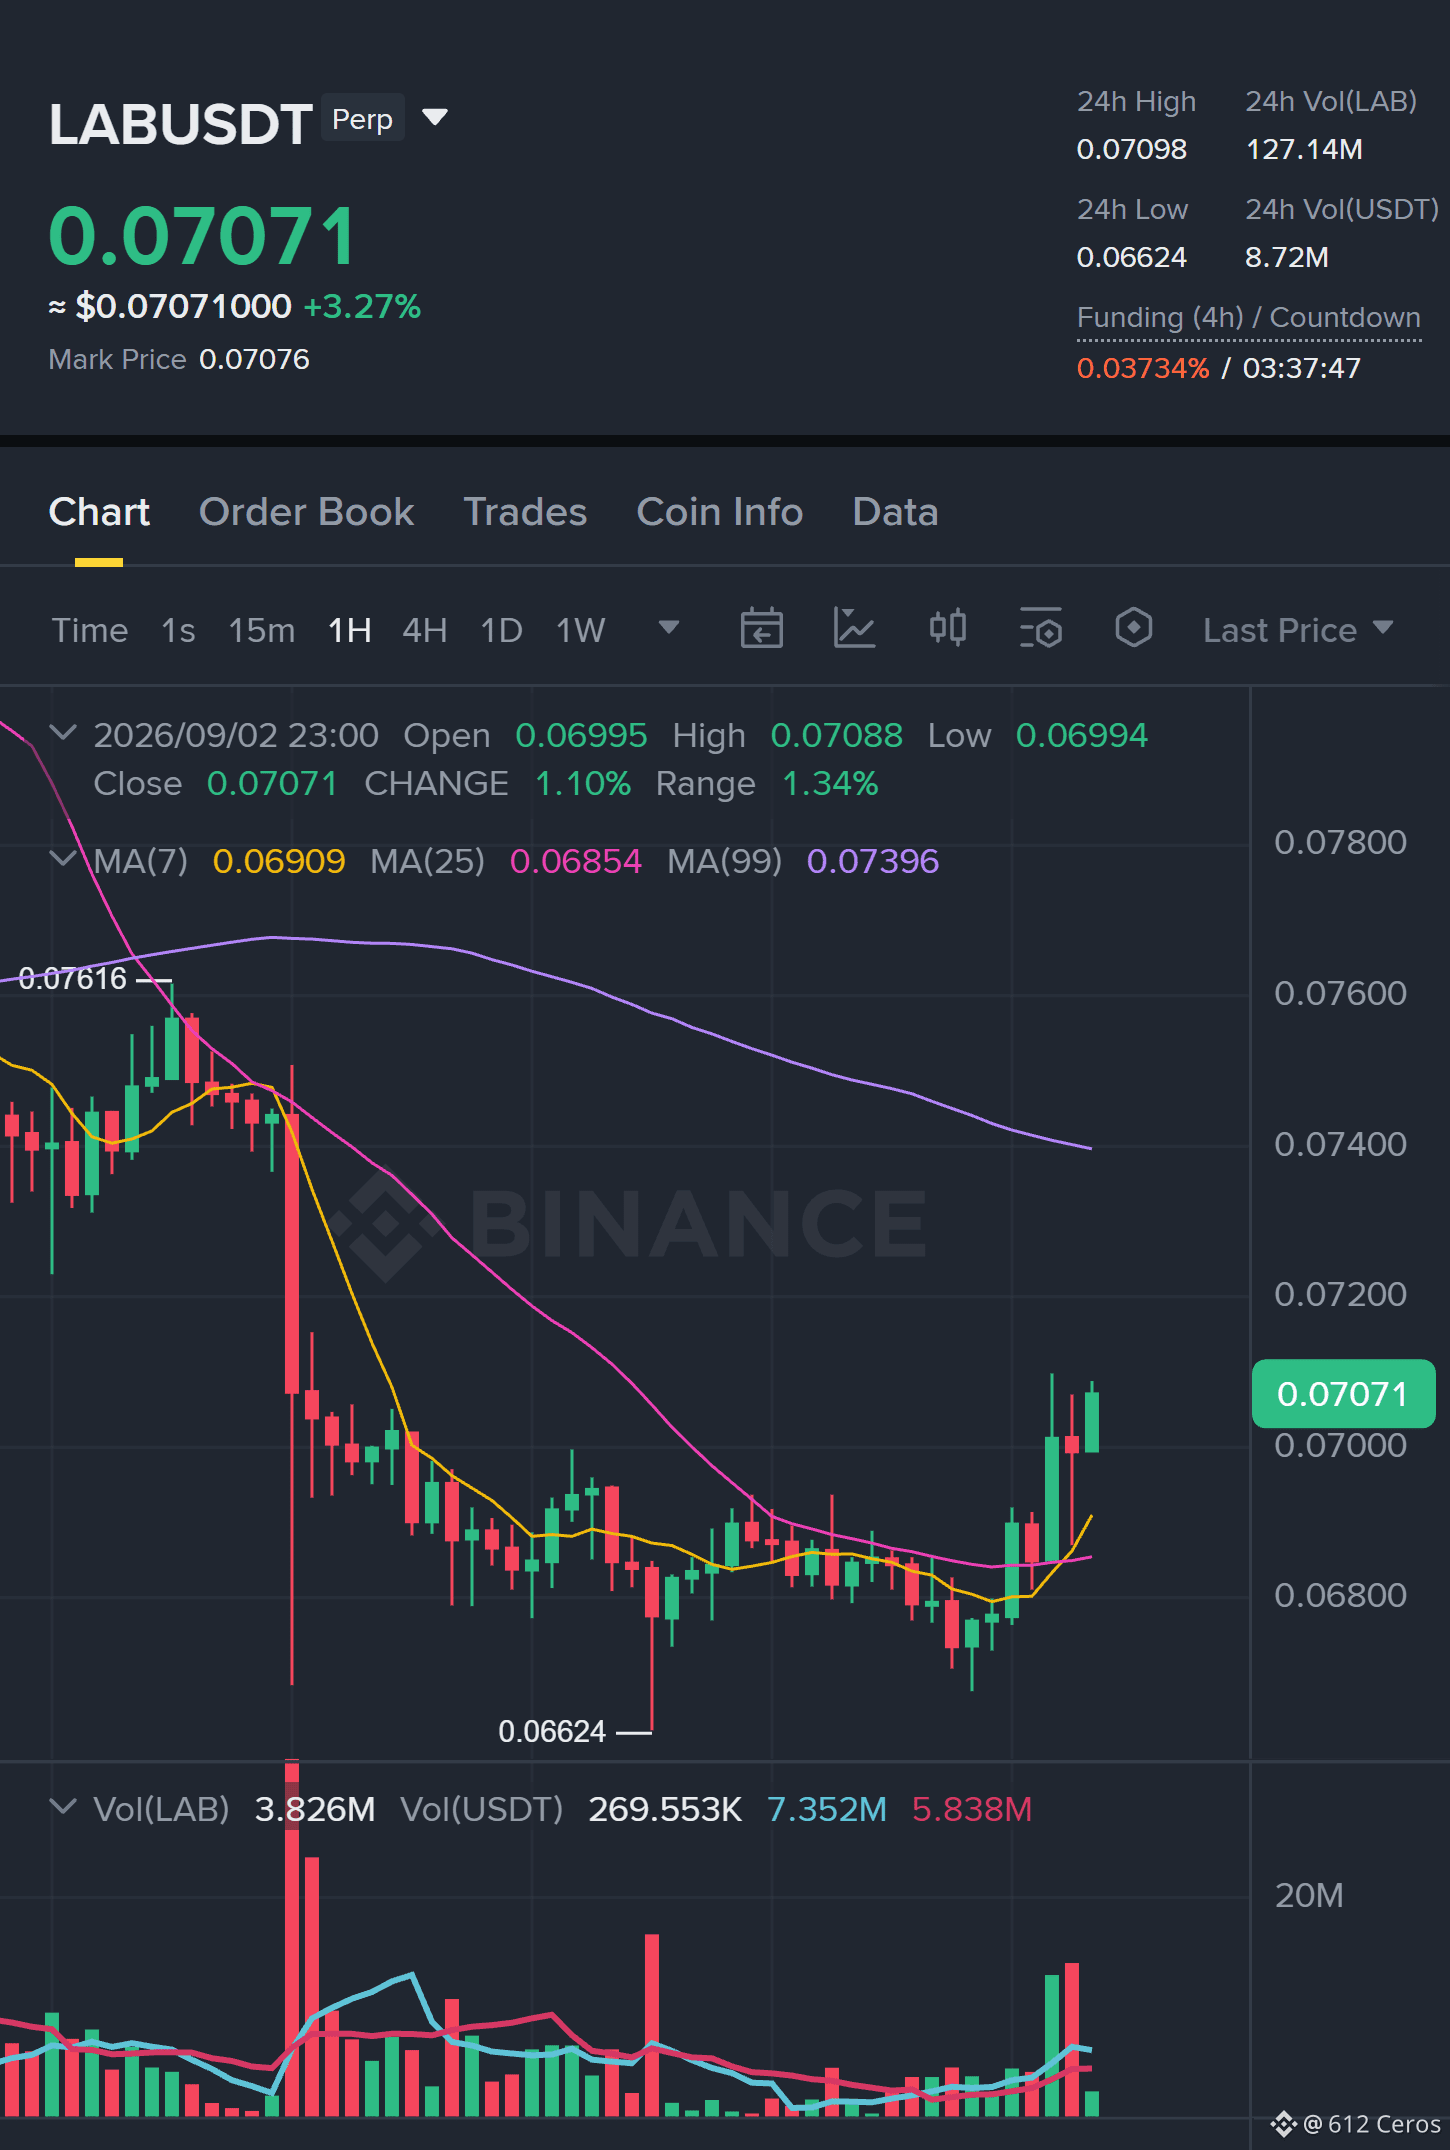
Everyone is staring at the daily bearish flag, but the 4-hour tape just whispered something else about $LAB /USDT.
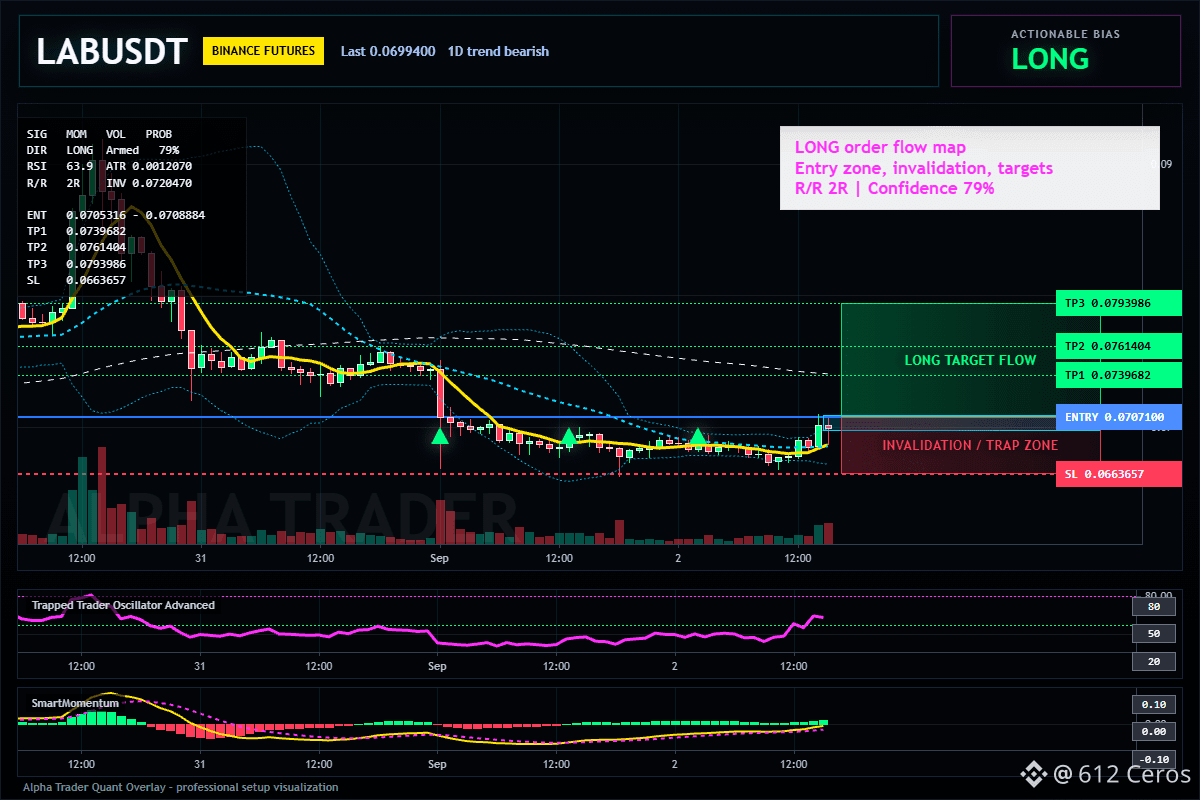
$LAB - 🟢 LONG · Conf 79%
Trade Plan:
Entry: 0.0705316 – 0.0708884
SL: 0.0663657
TP1: 0.0739682
TP2: 0.0761404
TP3: 0.0793986
Why this setup?
- The 1D trend is still bearish, yet the 4h regime just flipped to trend LONG with a 79% confidence score. That is not a coincidence; that is a rotational shift.
- RSI on the 15m is at 63.94, showing early momentum building but not yet overheated—there is still room to run before the exhaustion zone.
- Why now? The entry reference at 0.0707100 is sitting right at a pivot where the 1h ATR (0.001207) suggests a squeeze is due. Price is coiling under 0.0720470; a break above that invalidates the bearish daily narrative.
- Targets are mapped: TP1 at 0.0739682, TP2 at 0.0761404. The risk is defined at 0.0663657, giving you a risk-to-reward that is hard to ignore if you respect the stop.
- This is a trend-following setup on the lower timeframe, but remember: the daily is still bearish. This is not a reversal bet; it is a tactical long inside a larger downtrend. Do not confuse the two—size down if you are not used to trading against the daily flow.
Debate:
Which is it: are we front-running the daily reversal, or is this just a bull trap inside the 1D downtrend before the next leg down?
Click here to view the chart 👇️
⚠️ Personal market analysis only. NFA — manage risk and DYOR.
Educational content, not investment advice or a recommendation to buy, sell, deposit, or withdraw any asset. No paid promotion or referral/affiliate links.
$LAB - 🟢 LONG · Conf 79%
Trade Plan:
Entry: 0.0705316 – 0.0708884
SL: 0.0663657
TP1: 0.0739682
TP2: 0.0761404
TP3: 0.0793986
Why this setup?
- The 1D trend is still bearish, yet the 4h regime just flipped to trend LONG with a 79% confidence score. That is not a coincidence; that is a rotational shift.
- RSI on the 15m is at 63.94, showing early momentum building but not yet overheated—there is still room to run before the exhaustion zone.
- Why now? The entry reference at 0.0707100 is sitting right at a pivot where the 1h ATR (0.001207) suggests a squeeze is due. Price is coiling under 0.0720470; a break above that invalidates the bearish daily narrative.
- Targets are mapped: TP1 at 0.0739682, TP2 at 0.0761404. The risk is defined at 0.0663657, giving you a risk-to-reward that is hard to ignore if you respect the stop.
- This is a trend-following setup on the lower timeframe, but remember: the daily is still bearish. This is not a reversal bet; it is a tactical long inside a larger downtrend. Do not confuse the two—size down if you are not used to trading against the daily flow.
Debate:
Which is it: are we front-running the daily reversal, or is this just a bull trap inside the 1D downtrend before the next leg down?
Click here to view the chart 👇️
⚠️ Personal market analysis only. NFA — manage risk and DYOR.
Educational content, not investment advice or a recommendation to buy, sell, deposit, or withdraw any asset. No paid promotion or referral/affiliate links.