Liquidation Heatmap Shift: Whales Are Targeting the Below Liquidity Pool 📉🎯
As I mentioned earlier regarding the Fed macro pressure, the order book data confirms exactly where price is drawn next.
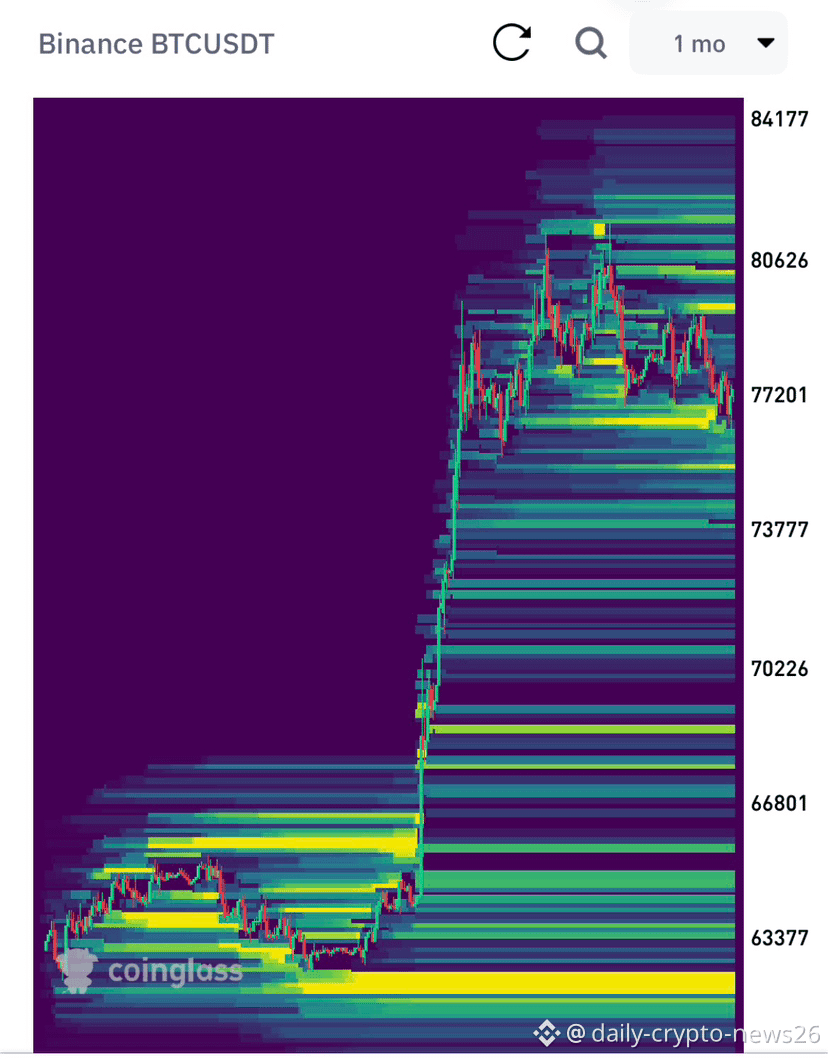
Looking at the 1-Month $BTC Coinglass Heatmap, liquidity clusters tell a clear story:
Massive Support Floor below ($63K – $66K): Bright yellow liquidity pools are heavily concentrated beneath current price levels around $63,300 – $66,800. Market makers and whales will likely seek to sweep these long liquidations before any sustainable trend reversal.
Overhead Resistance ($80K+): The liquidity above $80,600 – $84,100 has already been tapped and cleared out, leaving limited immediate buy-side liquidity nearby.
Path of Least Resistance: When overhead liquidity clears out during hawkish macro shifts, price naturally gravities down to hunt the heavy leveraged pools sitting near lower support zones.
Taking short-term profits or securing short setups on $BTC and $ETH aligns directly with where market liquidity is concentrated.
Are you derisking now, or waiting to buy the sweep around $63K–$66K? Drop your strategy below!
As I mentioned earlier regarding the Fed macro pressure, the order book data confirms exactly where price is drawn next.
Looking at the 1-Month $BTC Coinglass Heatmap, liquidity clusters tell a clear story:
Massive Support Floor below ($63K – $66K): Bright yellow liquidity pools are heavily concentrated beneath current price levels around $63,300 – $66,800. Market makers and whales will likely seek to sweep these long liquidations before any sustainable trend reversal.
Overhead Resistance ($80K+): The liquidity above $80,600 – $84,100 has already been tapped and cleared out, leaving limited immediate buy-side liquidity nearby.
Path of Least Resistance: When overhead liquidity clears out during hawkish macro shifts, price naturally gravities down to hunt the heavy leveraged pools sitting near lower support zones.
Taking short-term profits or securing short setups on $BTC and $ETH aligns directly with where market liquidity is concentrated.
Are you derisking now, or waiting to buy the sweep around $63K–$66K? Drop your strategy below!