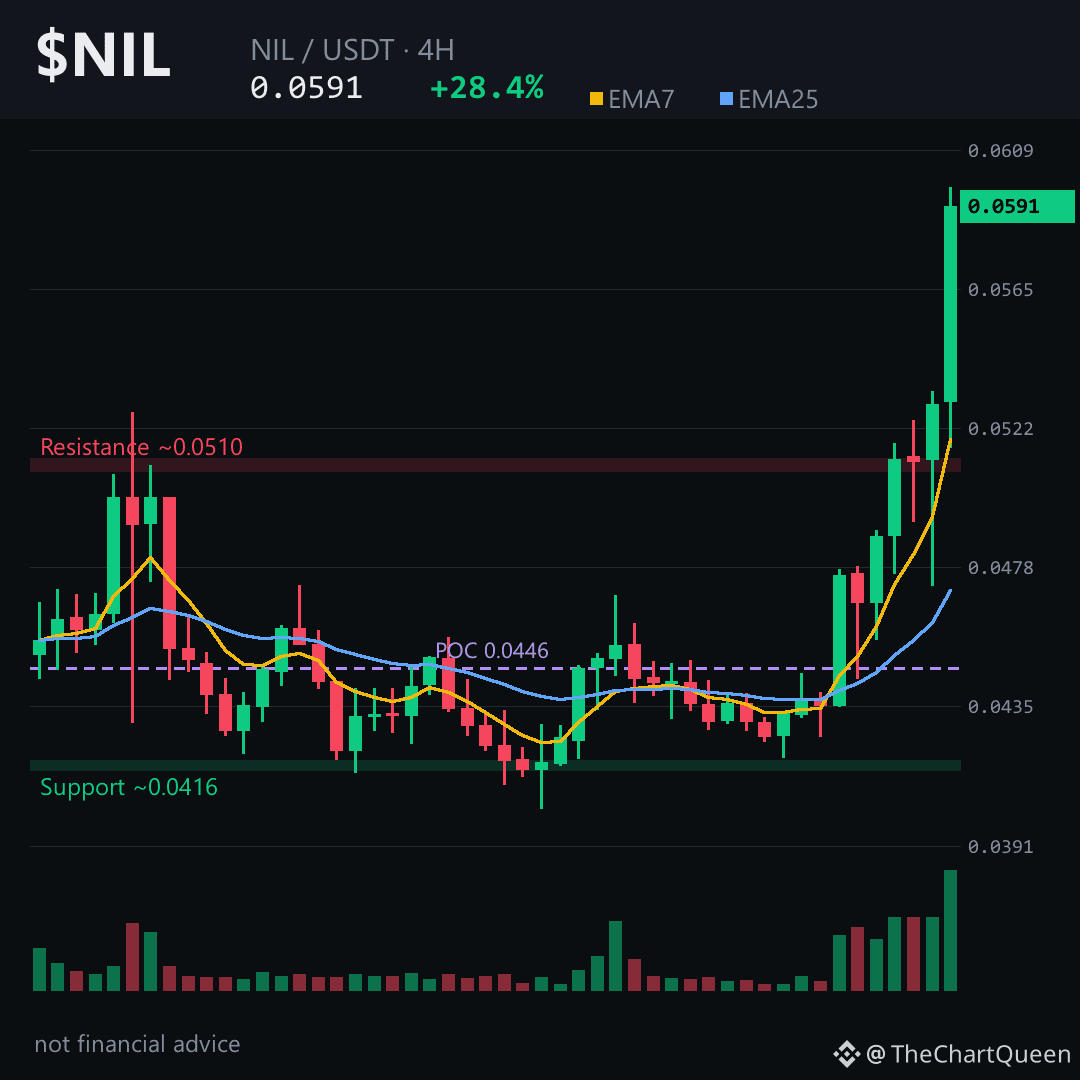
The headline screams another breakout for $NIL, yet the 4‑hour chart is whispering a different story. A tight bullish EMA crossover and an RSI stuck above 80 look tempting, but funding is negative (‑0.0546%) and the long‑short ratio sits at 0.82, hinting that shorts are being paid while the market leans short‑heavy – a classic hidden trap.
On the 4H picture the price hovers around the ~0.0586 zone. The next resistance lives near the ~0.064 area, while a break below the ~0.0557 level on a 4H close would invalidate the upside thesis. Tap $NIL to pull up the chart and see those zones yourself.
My read: $NIL is perched on a fragile bullish edge; the real risk is a slip under the ~0.0557 zone, which would flip the narrative fast.
If you want a follow‑up when that key level tests the waters, hit follow – I’ll break down the next move as soon as the price reacts. Which zone are you watching on NIL? 👇
⚠️ Not financial advice. DYOR.
#NIL #Crypto #BinanceSquare #TopGainer
On the 4H picture the price hovers around the ~0.0586 zone. The next resistance lives near the ~0.064 area, while a break below the ~0.0557 level on a 4H close would invalidate the upside thesis. Tap $NIL to pull up the chart and see those zones yourself.
My read: $NIL is perched on a fragile bullish edge; the real risk is a slip under the ~0.0557 zone, which would flip the narrative fast.
If you want a follow‑up when that key level tests the waters, hit follow – I’ll break down the next move as soon as the price reacts. Which zone are you watching on NIL? 👇
⚠️ Not financial advice. DYOR.
#NIL #Crypto #BinanceSquare #TopGainer