🎯 $ICP P/USDT Breakout Analysis – Bullish Momentum Building! 🚀
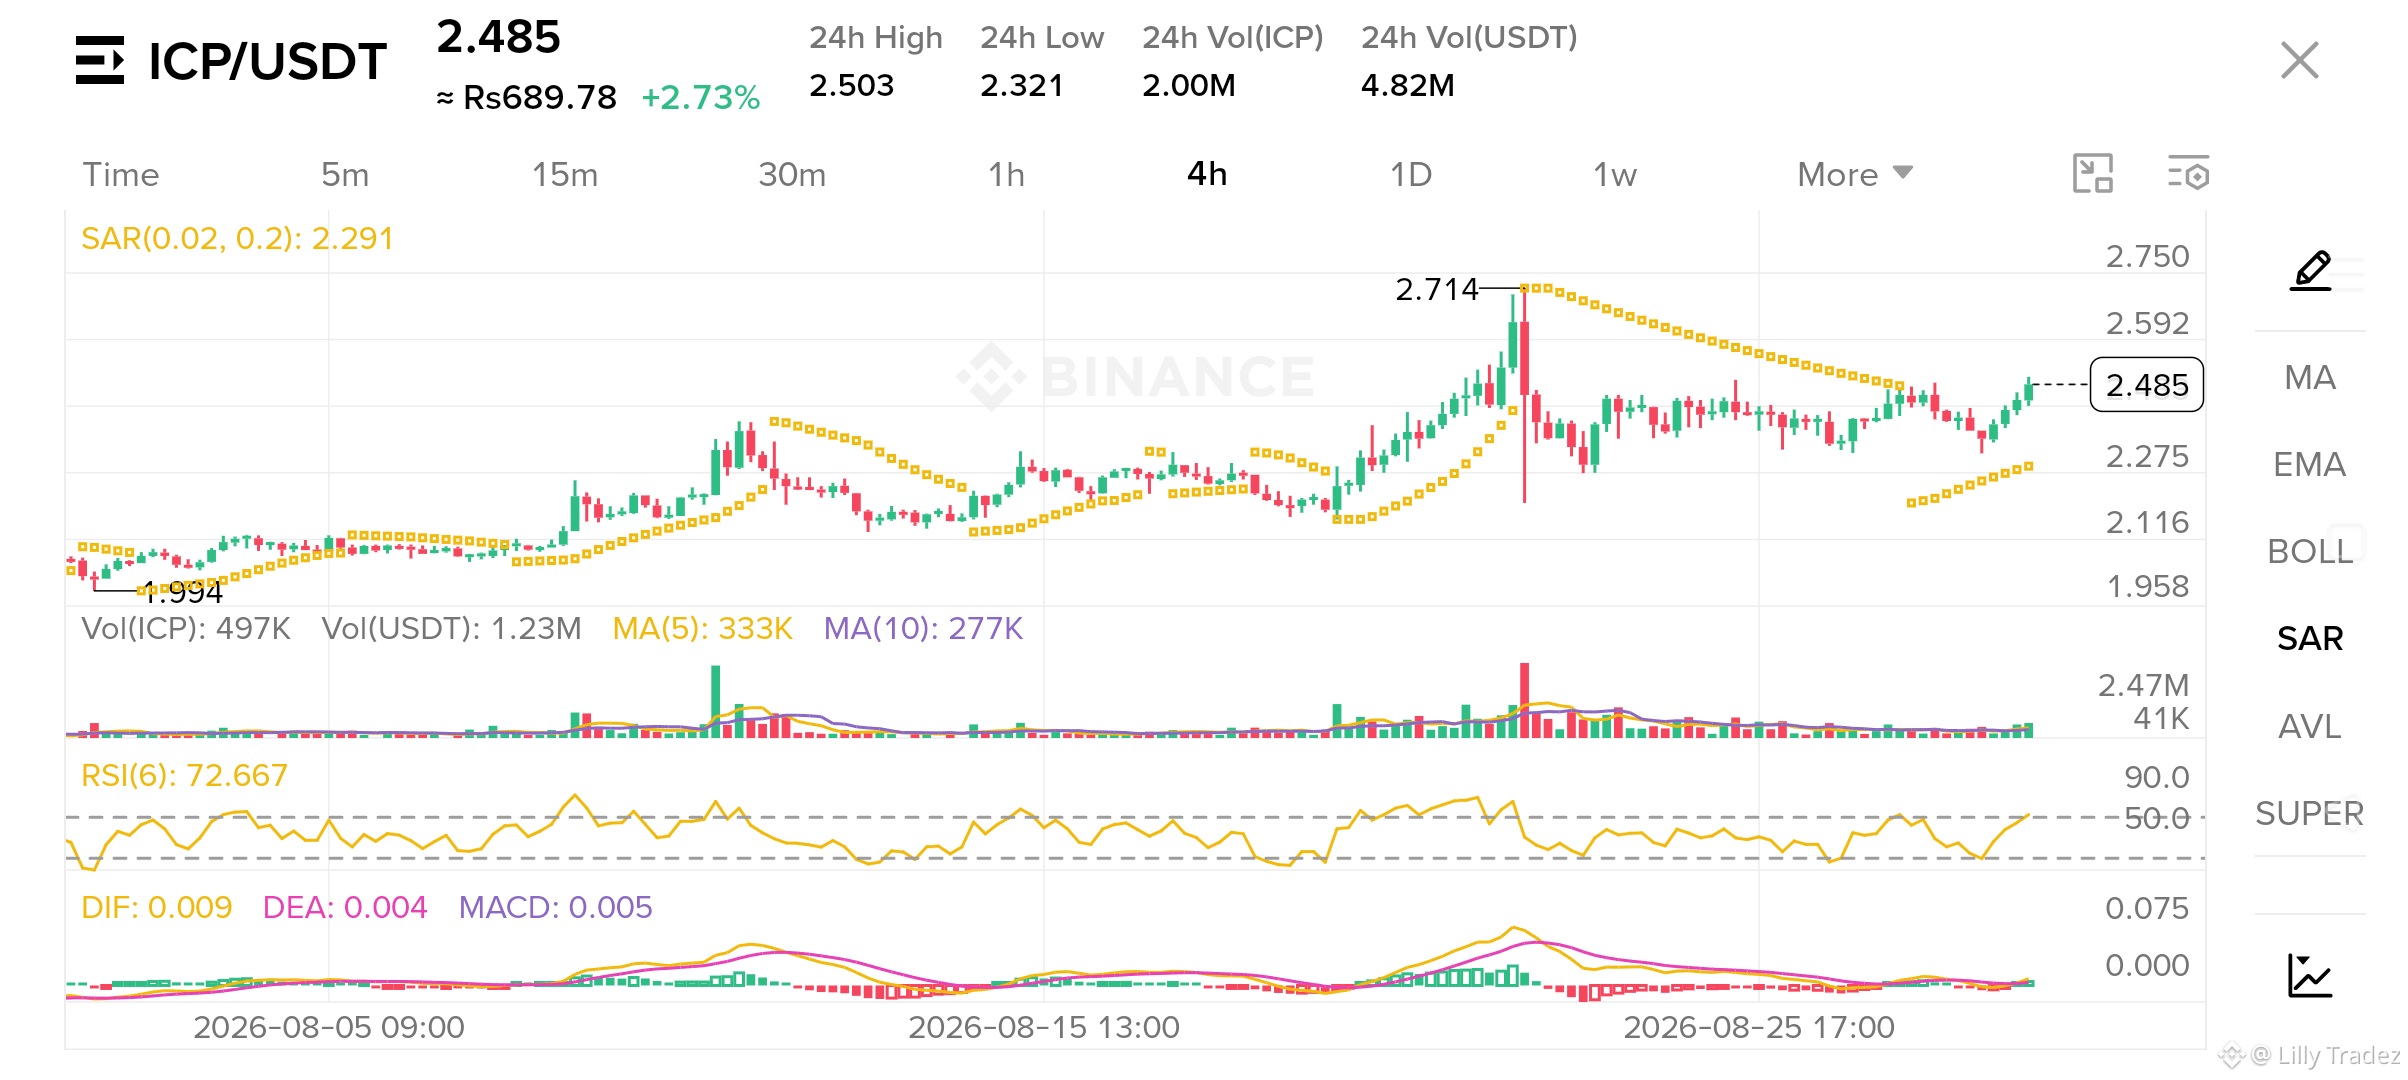
The 4-hour chart for ICP/USDT is displaying strong signs of a trend continuation after holding solid support. Here is a breakdown of the key technical metrics:
Current Price: $2.485 (+2.73%)
24h Range: High $2.503 | Low $2.321
SAR (0.02, 0.2): Currently at 2.291, forming below the current price action and signaling a continuation of the upward trend.
RSI (6): 72.66, reflecting strong buying pressure while approaching overbought territory.
MACD Metrics:
DIF: 0.009
DEA: 0.004
MACD Histogram: +0.005 (Positive crossover confirming momentum)
📈 Key Target: Retesting the recent local high at $2.714. A breakout above this level could unlock major upside expansion.
💡 Strategy: Protect profits with trailing stops and watch for consolidation around the current resistance zone.
The 4-hour chart for ICP/USDT is displaying strong signs of a trend continuation after holding solid support. Here is a breakdown of the key technical metrics:
Current Price: $2.485 (+2.73%)
24h Range: High $2.503 | Low $2.321
SAR (0.02, 0.2): Currently at 2.291, forming below the current price action and signaling a continuation of the upward trend.
RSI (6): 72.66, reflecting strong buying pressure while approaching overbought territory.
MACD Metrics:
DIF: 0.009
DEA: 0.004
MACD Histogram: +0.005 (Positive crossover confirming momentum)
📈 Key Target: Retesting the recent local high at $2.714. A breakout above this level could unlock major upside expansion.
💡 Strategy: Protect profits with trailing stops and watch for consolidation around the current resistance zone.