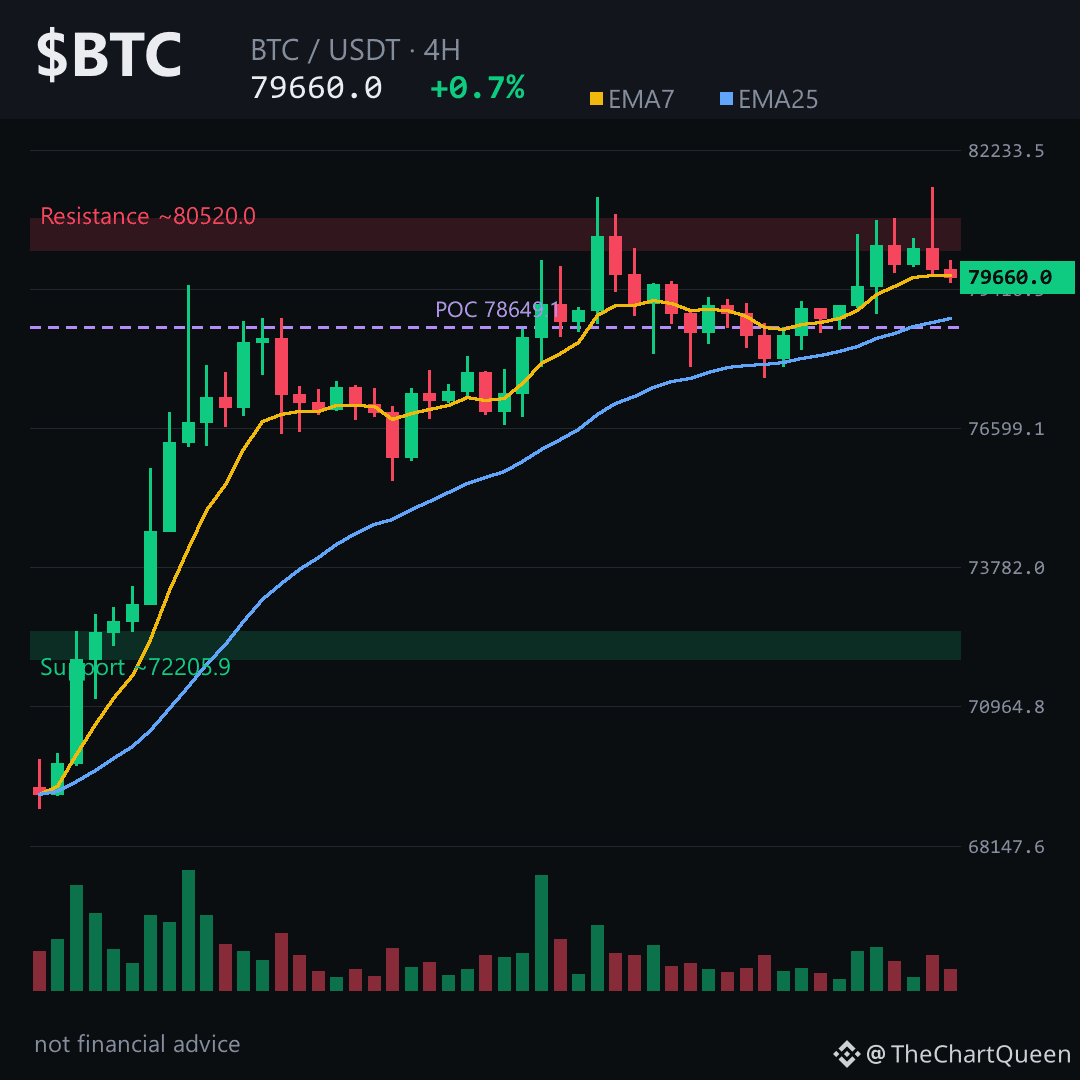
79.7K sits just 300 pts below $BTC’s current 79.66K – the 4‑hour EMA cluster is almost touching price.
Here’s why that matters 👇
The chart looks bullish, yet funding is positive and the long‑short ratio under 1, meaning longs are paying to stay while shorts hold a slight edge.
On the 4‑hour picture the key zones are: the pivot around 78.8K, an invalidation near 76.6K, and an upside objective near 82.8K. Lose the ~76.6K area on a 4H close and the bullish premise collapses; otherwise price could climb toward the 82‑83K band. Tap $BTC to pull up the chart and see these zones yourself.
My read: price is testing EMA support; a hold above the pivot keeps the upside alive, but a slip below 76.6K would flip the bias.
Follow for the next update when the 82.8K zone is tested – you’ll see how the funding pressure plays out. What level of $BTC are you watching most closely? 👇
⚠️ Not financial advice. DYOR.
#BTC #Bitcoin #Crypto #BinanceSquare
Here’s why that matters 👇
The chart looks bullish, yet funding is positive and the long‑short ratio under 1, meaning longs are paying to stay while shorts hold a slight edge.
On the 4‑hour picture the key zones are: the pivot around 78.8K, an invalidation near 76.6K, and an upside objective near 82.8K. Lose the ~76.6K area on a 4H close and the bullish premise collapses; otherwise price could climb toward the 82‑83K band. Tap $BTC to pull up the chart and see these zones yourself.
My read: price is testing EMA support; a hold above the pivot keeps the upside alive, but a slip below 76.6K would flip the bias.
Follow for the next update when the 82.8K zone is tested – you’ll see how the funding pressure plays out. What level of $BTC are you watching most closely? 👇
⚠️ Not financial advice. DYOR.
#BTC #Bitcoin #Crypto #BinanceSquare