
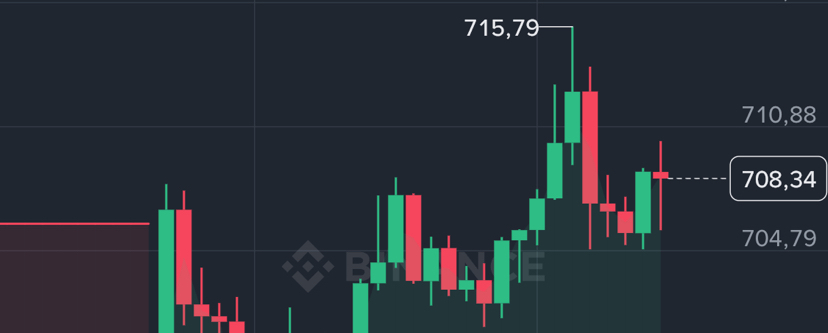

$BNB 1-Hour Chart Rebounds Above $708! Breakout Pending?
BNB/USDT ($BNB ) is showing a solid short-term recovery on the 1-Hour timeframe, bouncing cleanly from the $692.10 local low and pushing back up toward $708.29!
🔑

Key Technical Highlights from the 1H Chart:
Supertrend Support Active: The Supertrend indicator remains bullish on the 1H chart at $699.67, acting as dynamic short-term support for buyers.
MACD Momentum: MACD lines remain in positive territory (DIF: 2.16 / DEA: 2.06), signaling that short-term buying pressure is still intact.
Key Technical Levels to Watch:
• Immediate Resistance: $710.88 - $715.79
• Key Support: $699.67 (Supertrend Line)
• Local Low Support: $692.10
What’s your short-term move on $BNB?
Do you expect a breakout retest of the $715.79 high today, or short-term consolidation around $705? Drop your analysis below! 👇
#BNB #CryptoAnalysis #BinanceSquare #TradingSignals #CryptoTrends