
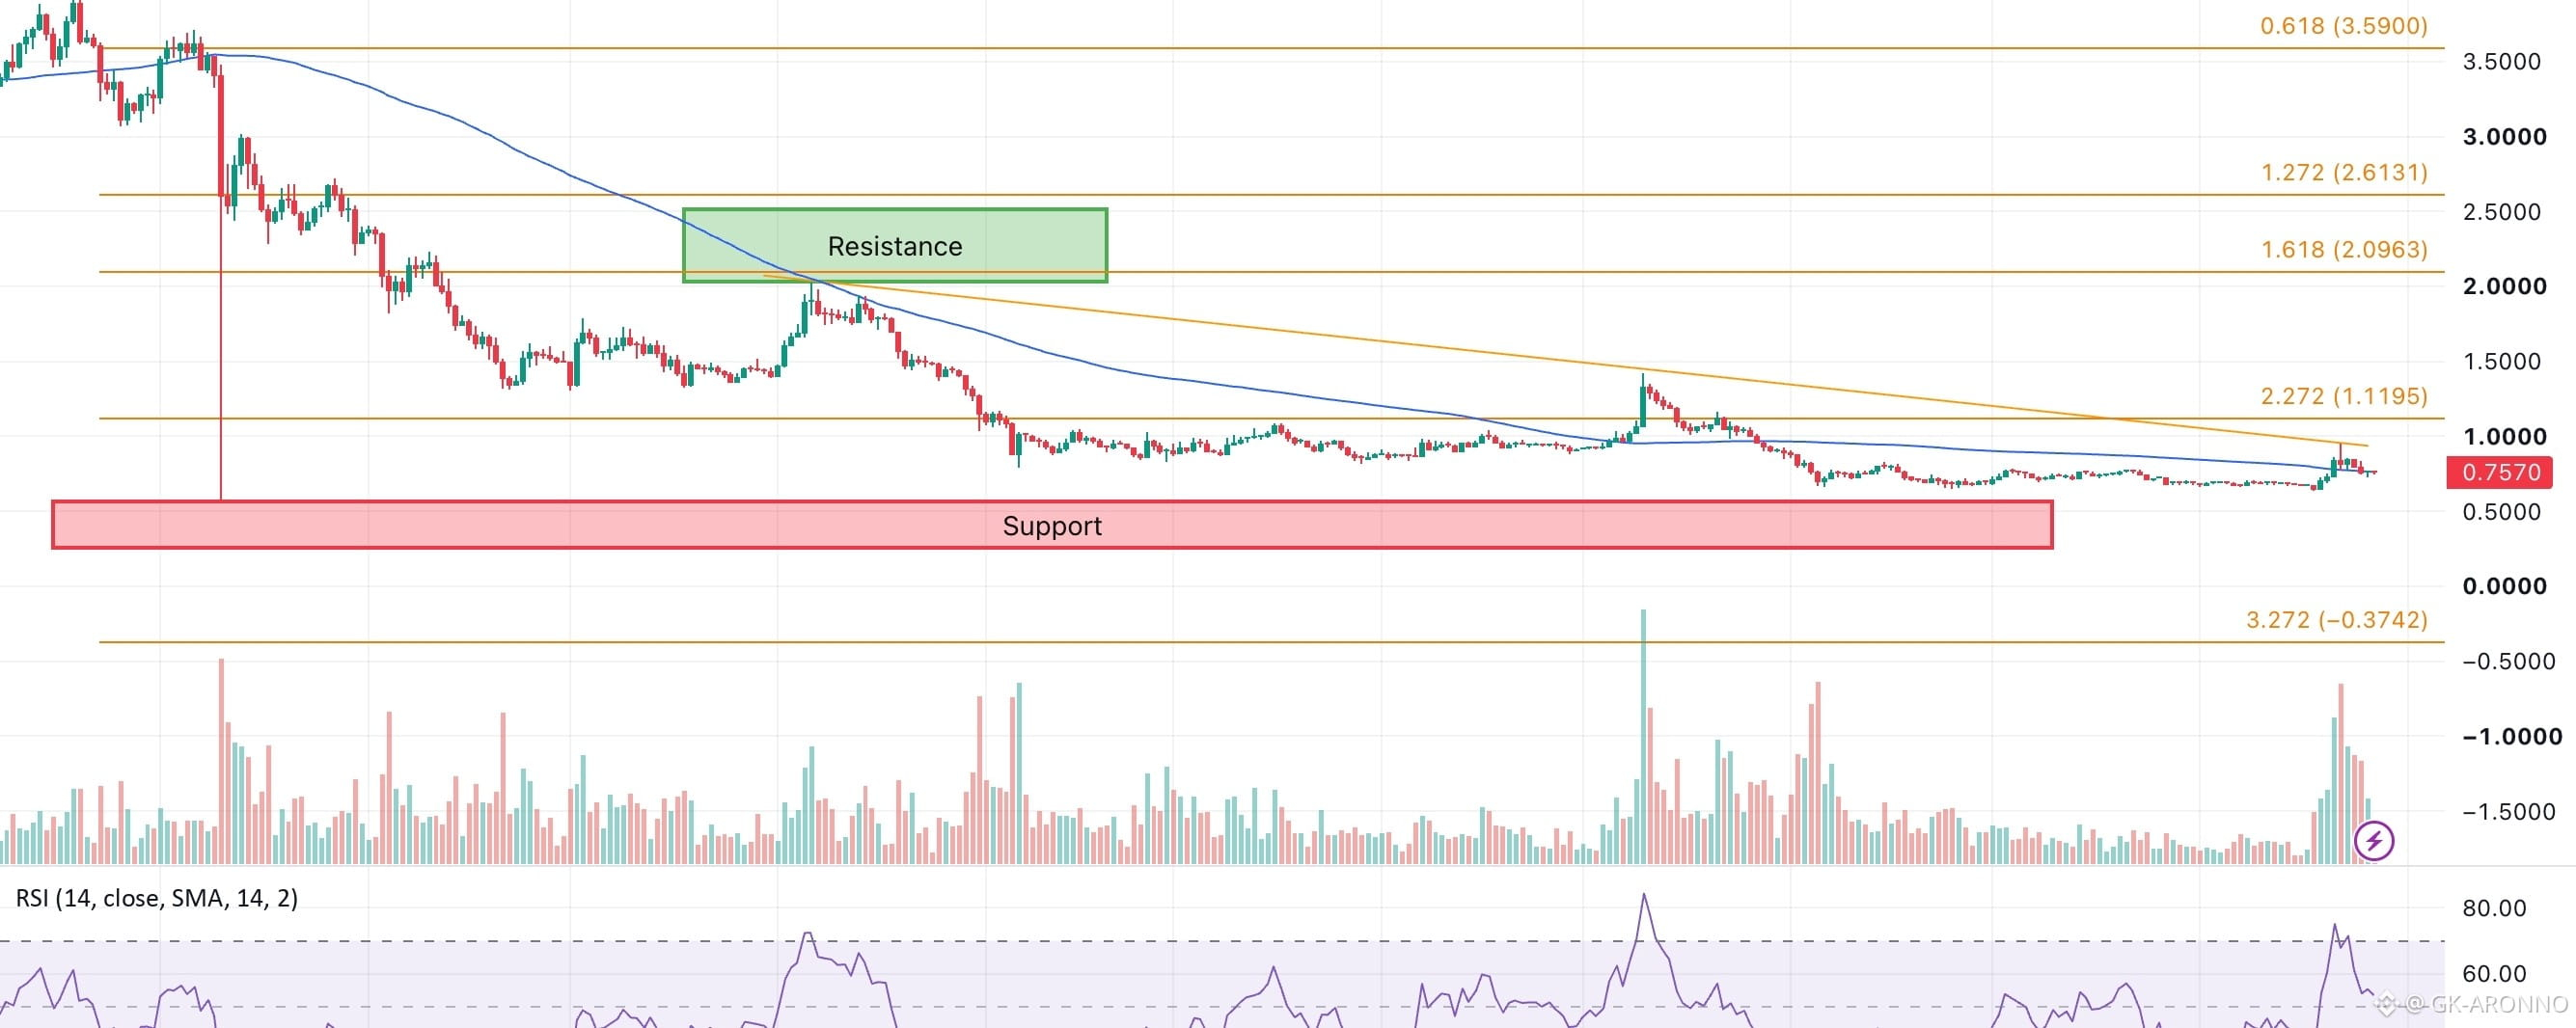


The SUI price has broken above a year-long descending trendline and reclaimed the 100-day SMA at $0.7711.
SUI’s market cap climbed from $2.7 billion to $3.45 billion as the price moved toward $0.84.
* The $0.8936 resistance level could determine whether SUI makes a move toward the $1 mark.
The SUI price is showing some real strength after spending most of the past year trapped in a frustrating downtrend. SUI has pushed back above $0.80, broken through a long-standing descending trendline, and reclaimed its 100-day moving average, all signs that buyers are beginning to regain control.
The recovery has also been backed by a noticeable increase in capital flowing into the market. SUI's market cap climbed from roughly $2.7 billion to around $3.45 billion in just a few days, adding nearly $750 million in value. That is usually a good sign because it suggests fresh money is entering the ecosystem rather than the price simply drifting higher on weak volume.
We took a look at the charts, and the technical setup has improved quite a bit. The breakout above the year-long downtrend is one of the strongest bullish signals SUI has produced in 2026 so far. The token is also holding above its 100-day SMA near $0.771, which now becomes a key level for bulls to defend.
The next big test sits around $0.8936. If SUI can break above that resistance and hold it, the path toward the psychological $1 level becomes much clearer. Beyond $1, traders will likely start paying attention to the $1.10-$1.20 region as the next potential target zone.
For now, the setup is fairly straightforward. As long as the SUI price stays above the $0.77-$0.80 area, the breakout structure remains intact. CoinCodex's one-month forecast currently sits around $0.6178, which makes the current battle around resistance even more important for determining where SUI heads next.
