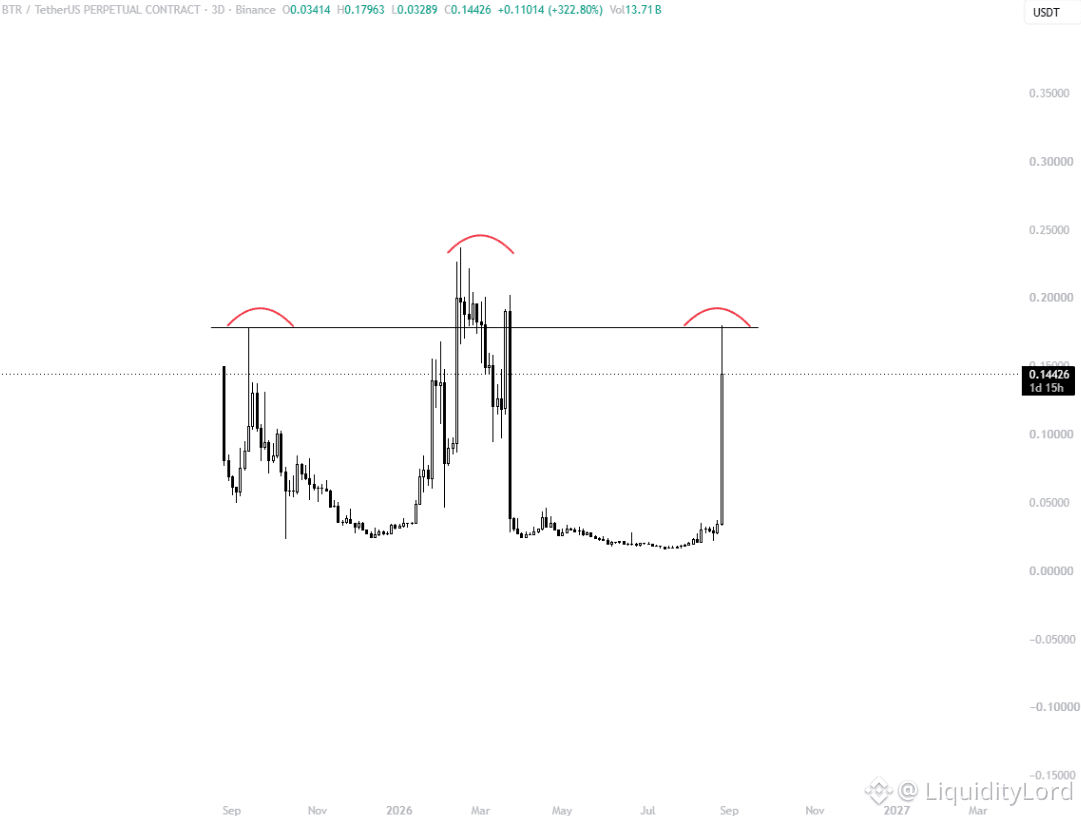
🤔 BTR IS TESTING 0.18 RESISTANCE
BTR trades around 0.14426 on the 3D chart after a 322% expansion from the accumulation zone near 0.02-0.04. Price has now returned toward the 0.18 resistance that rejected previous rallies.
📊 STRUCTURE CHECK
The chart shows repeated reactions around 0.18. Earlier attempts reached 0.20-0.24 before sellers forced retracements.
BTR has emerged from a prolonged base with momentum. A clean break above 0.18 would be the key confirmation for another expansion.
🎯 TARGET MAP
TP1: 0.180
TP2: 0.200
TP3: 0.240
Stop Loss: 0.100
TP1 is historical resistance, TP2 the next psychological checkpoint, TP3 is the broader extension if momentum continues.
⚠ INVALIDATION
The bullish setup weakens if BTR rejects 0.18 and loses 0.10. A deeper return toward the accumulation area would suggest the breakout has failed.
🧩 EXECUTION DYNAMICS
STONfi is relevant to execution, not the BTR thesis. After a move of this magnitude, liquidity can become fragmented as traders adjust positions around rapidly changing prices. RFQ-based routing allows competing resolvers to search available liquidity and compare quotes across different sources.
That matters during volatile expansions. STONfi does not create BTR's breakout or determine whether 0.18 will break. The chart defines the directional thesis, while the execution layer focuses on accessing competitive liquidity efficiently as spreads and available depth change.
TON remains the broader ecosystem reference, while BTR needs independent confirmation from its own price structure.
🔎 MY PLAN
I would not chase BTR below 0.18 after a 322% move. My preferred scenario is a breakout above 0.18 followed by a retest that holds. If buyers turn it into support, 0.20 comes first, with 0.24 as the broader target.
If price rejects 0.18 and loses 0.10, I would step aside.
Confirmation above 0.18 matters next.
NFA - DYOR
$BTR
BTR trades around 0.14426 on the 3D chart after a 322% expansion from the accumulation zone near 0.02-0.04. Price has now returned toward the 0.18 resistance that rejected previous rallies.
📊 STRUCTURE CHECK
The chart shows repeated reactions around 0.18. Earlier attempts reached 0.20-0.24 before sellers forced retracements.
BTR has emerged from a prolonged base with momentum. A clean break above 0.18 would be the key confirmation for another expansion.
🎯 TARGET MAP
TP1: 0.180
TP2: 0.200
TP3: 0.240
Stop Loss: 0.100
TP1 is historical resistance, TP2 the next psychological checkpoint, TP3 is the broader extension if momentum continues.
⚠ INVALIDATION
The bullish setup weakens if BTR rejects 0.18 and loses 0.10. A deeper return toward the accumulation area would suggest the breakout has failed.
🧩 EXECUTION DYNAMICS
STONfi is relevant to execution, not the BTR thesis. After a move of this magnitude, liquidity can become fragmented as traders adjust positions around rapidly changing prices. RFQ-based routing allows competing resolvers to search available liquidity and compare quotes across different sources.
That matters during volatile expansions. STONfi does not create BTR's breakout or determine whether 0.18 will break. The chart defines the directional thesis, while the execution layer focuses on accessing competitive liquidity efficiently as spreads and available depth change.
TON remains the broader ecosystem reference, while BTR needs independent confirmation from its own price structure.
🔎 MY PLAN
I would not chase BTR below 0.18 after a 322% move. My preferred scenario is a breakout above 0.18 followed by a retest that holds. If buyers turn it into support, 0.20 comes first, with 0.24 as the broader target.
If price rejects 0.18 and loses 0.10, I would step aside.
Confirmation above 0.18 matters next.
NFA - DYOR
$BTR