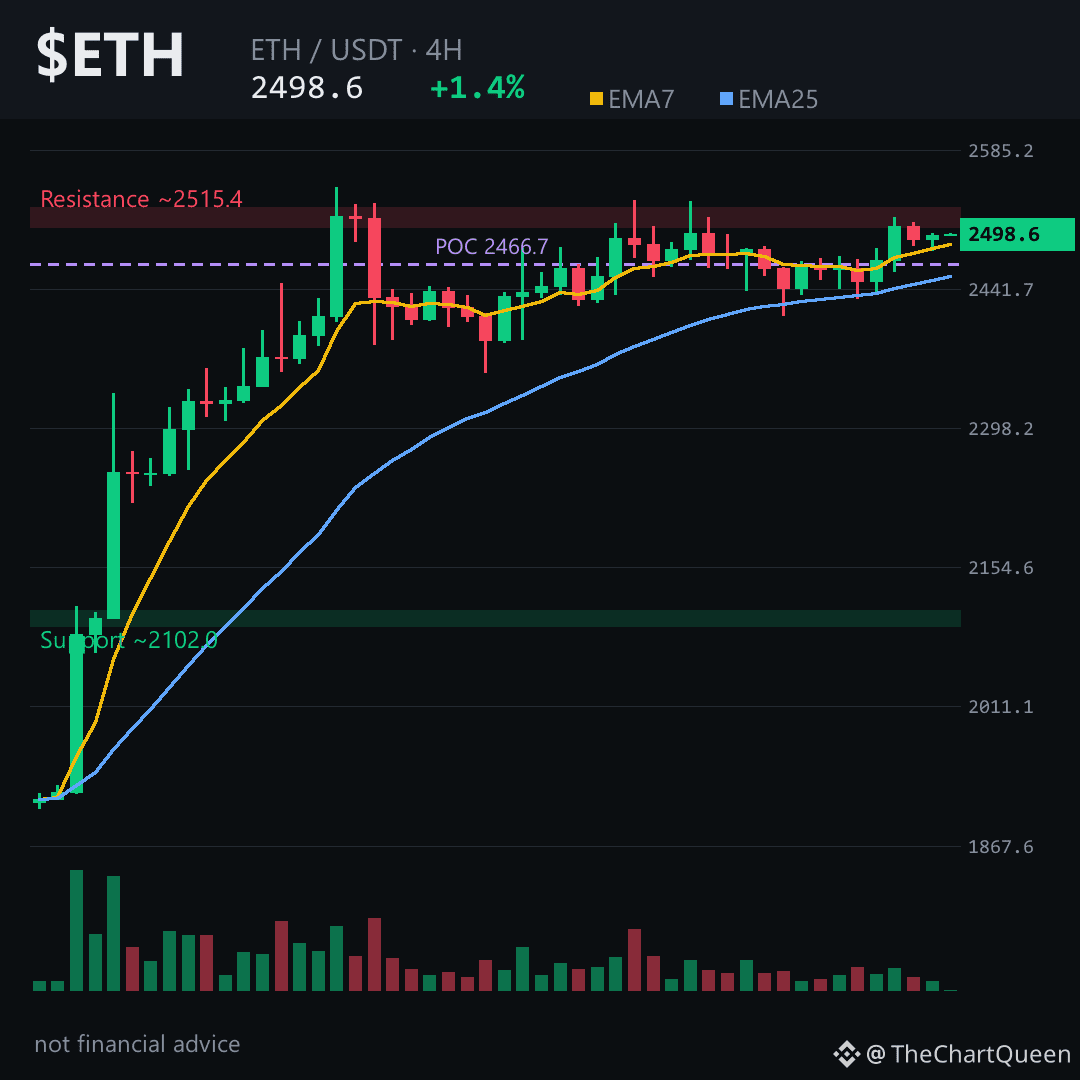
Ethereum just cracked the $2,487 EMA – the next leg could rocket it toward $2,635. 👀
Read the 4‑hour picture 👇
Price looks bullish, but a tiny funding fee (0.006 % / longs paying shorts) and a 2.38 × long‑short ratio hint that leverage is stacking on the upside, a classic warning sign of a hidden pull‑back.
On the 4‑hour chart the swing sits around the $2,487 zone, with the danger line near $2,405. Lose that area on a 4H close and the bullish case evaporates. Hold above it and the next target zone sits near $2,635, where the EMA gap and volume profile line up for a short‑term thrust.
My read: $ETH is primed to test the $2,635 objective, but a dip below $2,405 would flip the bias.
Follow me for the next update when the price either punches through the $2,635 target or slides back under $2,405 – you’ll catch the shift before the crowd does.
What’s your take – will $ETH stay above $2,405 or slip toward the next support? 👇
⚠️ Not financial advice. DYOR.
#ETH #Ethereum #Crypto #BinanceSquare
Read the 4‑hour picture 👇
Price looks bullish, but a tiny funding fee (0.006 % / longs paying shorts) and a 2.38 × long‑short ratio hint that leverage is stacking on the upside, a classic warning sign of a hidden pull‑back.
On the 4‑hour chart the swing sits around the $2,487 zone, with the danger line near $2,405. Lose that area on a 4H close and the bullish case evaporates. Hold above it and the next target zone sits near $2,635, where the EMA gap and volume profile line up for a short‑term thrust.
My read: $ETH is primed to test the $2,635 objective, but a dip below $2,405 would flip the bias.
Follow me for the next update when the price either punches through the $2,635 target or slides back under $2,405 – you’ll catch the shift before the crowd does.
What’s your take – will $ETH stay above $2,405 or slip toward the next support? 👇
⚠️ Not financial advice. DYOR.
#ETH #Ethereum #Crypto #BinanceSquare