🚨 $MUBARAK / USDT 1D Chart Analysis & Price Predictions 🚨
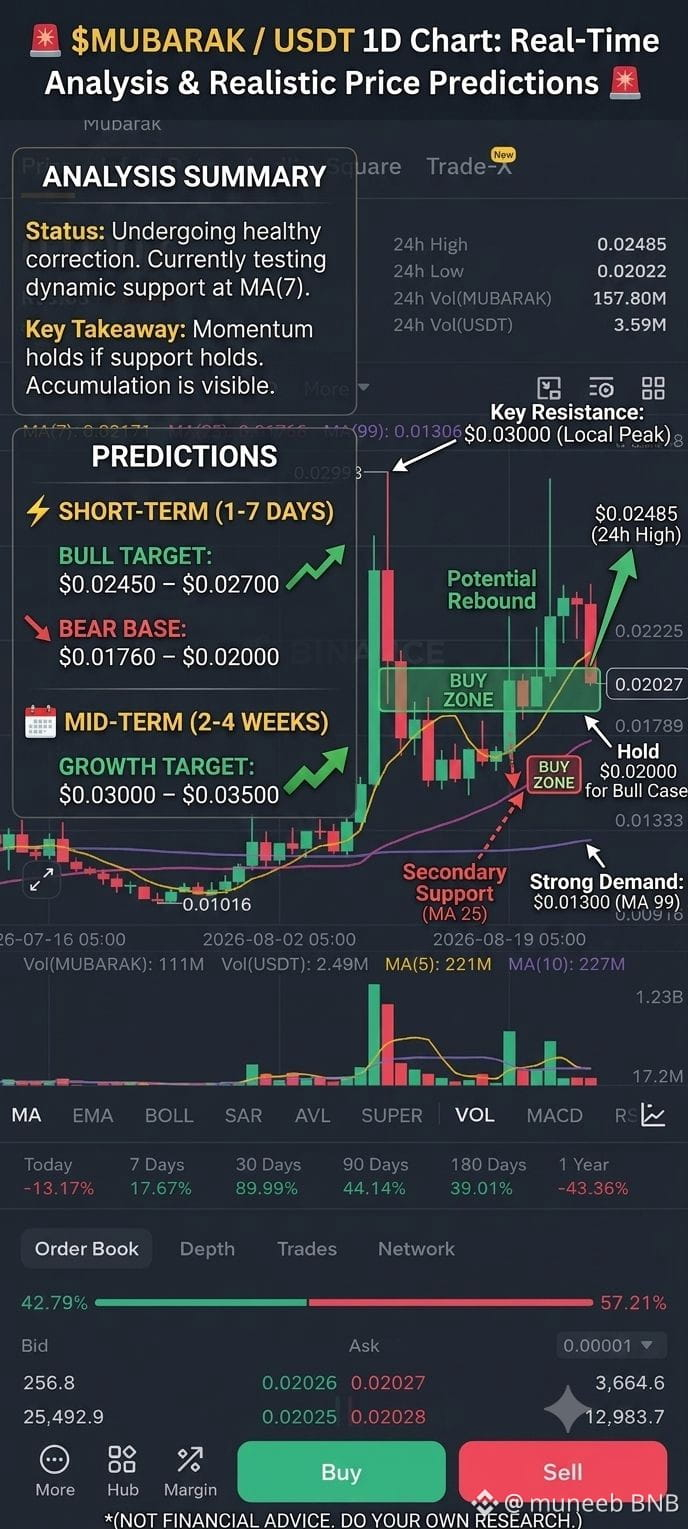
$MUBARAK is undergoing a healthy cool-off after a sharp rally. Price is testing critical dynamic support around the MA(7) line.
Technical Breakdown
Current Price: $0.02031 (-15.34%)
Immediate Support: $0.02020 – $0.01766 (24h low & MA(25) confluence zone)
Strong Demand Zone: $0.01300 (MA(99) baseline)
Key Resistance: $0.02485 (24h high) and $0.03000 (Recent local peak)
Volume: Declining on the pullback, signaling consolidation rather than aggressive dumping.
Realistic Price Predictions
Short-Term (1–7 Days):
Bullish Scenario: A hold above $0.02000 targets a bounce back toward $0.02450 – $0.02700.
Bearish Scenario: Losing $0.02000 opens a retest of MA(25) at $0.01760.
Mid-Term (2–4 Weeks):
If buyers accumulate around the $0.0176 – $0.0200 support base, momentum can push price to test $0.03000 – $0.03500.
💡 Trading Strategy: Avoid FOMO buying during red candles. Wait for confirmation of a bounce at $0.0200 or set limit entries near $0.0178. Keep tight stop-losses below $0.0168.
$MUBARAK
#KazakhstanCutsOilOutputForecastTo96MTons #JapanNoAdditionalOilReserveReleaseInSepOct #SamsungSKHynixLeveragedETFsPostFirstMonthlyOutflow #ThailandToExpandSECDigitalAssetProbePowers #OilHoldsLosses
$MUBARAK is undergoing a healthy cool-off after a sharp rally. Price is testing critical dynamic support around the MA(7) line.
Technical Breakdown
Current Price: $0.02031 (-15.34%)
Immediate Support: $0.02020 – $0.01766 (24h low & MA(25) confluence zone)
Strong Demand Zone: $0.01300 (MA(99) baseline)
Key Resistance: $0.02485 (24h high) and $0.03000 (Recent local peak)
Volume: Declining on the pullback, signaling consolidation rather than aggressive dumping.
Realistic Price Predictions
Short-Term (1–7 Days):
Bullish Scenario: A hold above $0.02000 targets a bounce back toward $0.02450 – $0.02700.
Bearish Scenario: Losing $0.02000 opens a retest of MA(25) at $0.01760.
Mid-Term (2–4 Weeks):
If buyers accumulate around the $0.0176 – $0.0200 support base, momentum can push price to test $0.03000 – $0.03500.
💡 Trading Strategy: Avoid FOMO buying during red candles. Wait for confirmation of a bounce at $0.0200 or set limit entries near $0.0178. Keep tight stop-losses below $0.0168.
$MUBARAK
#KazakhstanCutsOilOutputForecastTo96MTons #JapanNoAdditionalOilReserveReleaseInSepOct #SamsungSKHynixLeveragedETFsPostFirstMonthlyOutflow #ThailandToExpandSECDigitalAssetProbePowers #OilHoldsLosses