🚀 $CYS /USDT LONG — Daily Trend vs 4H Breakdown
Everyone is watching the 4H pullback, but the bigger picture is telling a different story. 👀
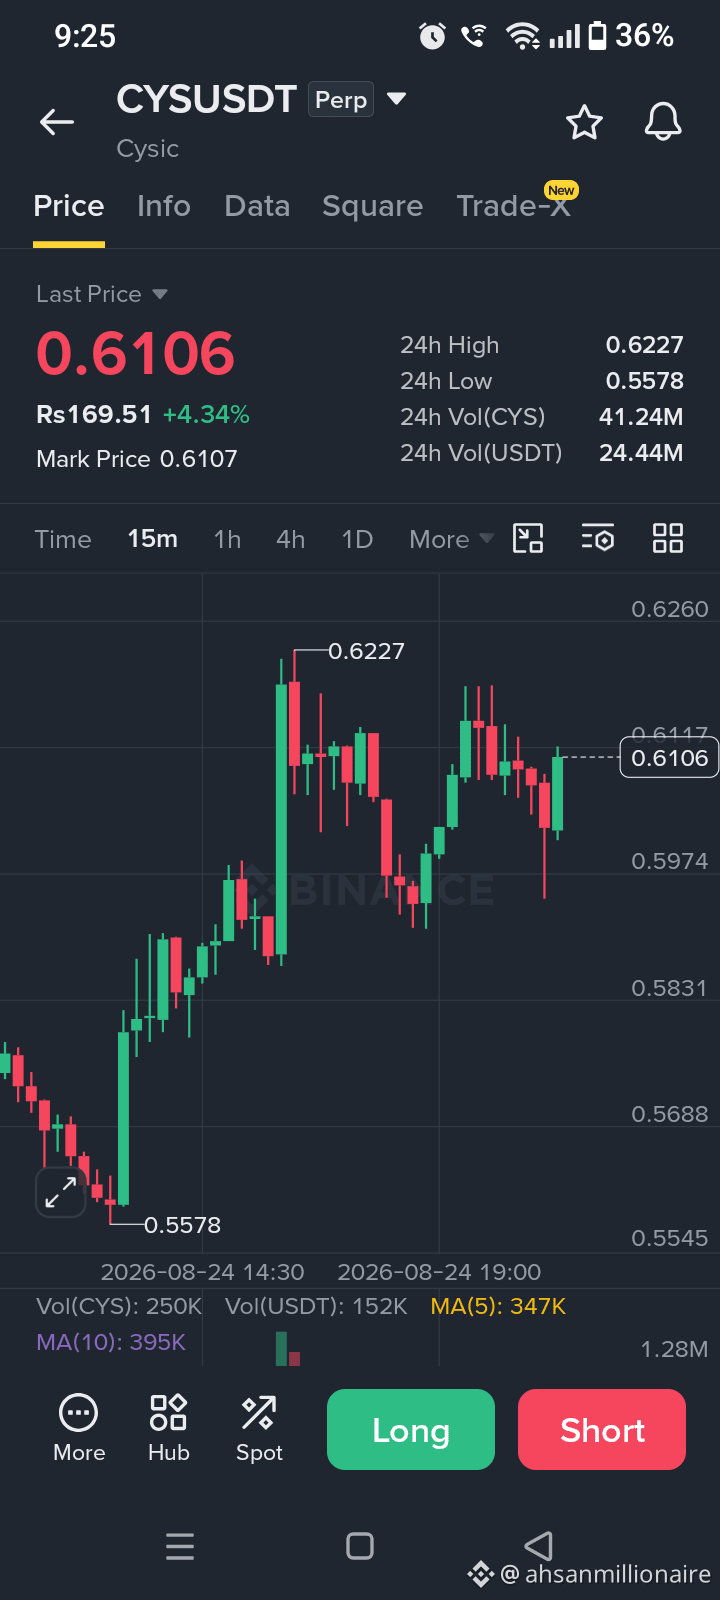
$CYS is currently testing a key support area while the daily structure remains bullish. If buyers defend the 0.6074–0.6119 zone, this pullback could become the launchpad for the next move higher.
📊 Trade Plan
🟢 LONG | Confidence: 80%
Entry: 0.6074598 – 0.6119402
SL: 0.5678290
TP1: 0.6411033
TP2: 0.6620388
TP3: 0.6934421
🔥 Why I'm Watching $CYS
The 1D bullish structure is still intact, while the 4H retracement may simply be shaking out weak hands.
The 15M RSI around 58 shows momentum is recovering without being heavily overbought. Meanwhile, the 0.6074 support band is becoming the key area for buyers to defend.
ATR is around 0.0175, suggesting volatility is tightening. If demand steps in, that compression could provide fuel for a breakout toward 0.64 and beyond.
The main invalidation is clear: if loses the 0.5678 SL, the bullish thesis is no longer valid.
🎯 0.6411 → 0.6620 → 0.6934
🗣️ Debate
Is $CYS preparing to reclaim 0.64, or is this setup becoming a bull trap?
Watch the support. Watch the volume. Let price confirm. 📈
Trade responsibly and never risk more than you can afford to lose.
👇 Click here to Trade#SP500FuturesFall #BrentDrops1.87% #SamsungFalls8.97%DraggingKospiDown3.24%
Everyone is watching the 4H pullback, but the bigger picture is telling a different story. 👀
$CYS is currently testing a key support area while the daily structure remains bullish. If buyers defend the 0.6074–0.6119 zone, this pullback could become the launchpad for the next move higher.
📊 Trade Plan
🟢 LONG | Confidence: 80%
Entry: 0.6074598 – 0.6119402
SL: 0.5678290
TP1: 0.6411033
TP2: 0.6620388
TP3: 0.6934421
🔥 Why I'm Watching $CYS
The 1D bullish structure is still intact, while the 4H retracement may simply be shaking out weak hands.
The 15M RSI around 58 shows momentum is recovering without being heavily overbought. Meanwhile, the 0.6074 support band is becoming the key area for buyers to defend.
ATR is around 0.0175, suggesting volatility is tightening. If demand steps in, that compression could provide fuel for a breakout toward 0.64 and beyond.
The main invalidation is clear: if loses the 0.5678 SL, the bullish thesis is no longer valid.
🎯 0.6411 → 0.6620 → 0.6934
🗣️ Debate
Is $CYS preparing to reclaim 0.64, or is this setup becoming a bull trap?
Watch the support. Watch the volume. Let price confirm. 📈
Trade responsibly and never risk more than you can afford to lose.
👇 Click here to Trade#SP500FuturesFall #BrentDrops1.87% #SamsungFalls8.97%DraggingKospiDown3.24%