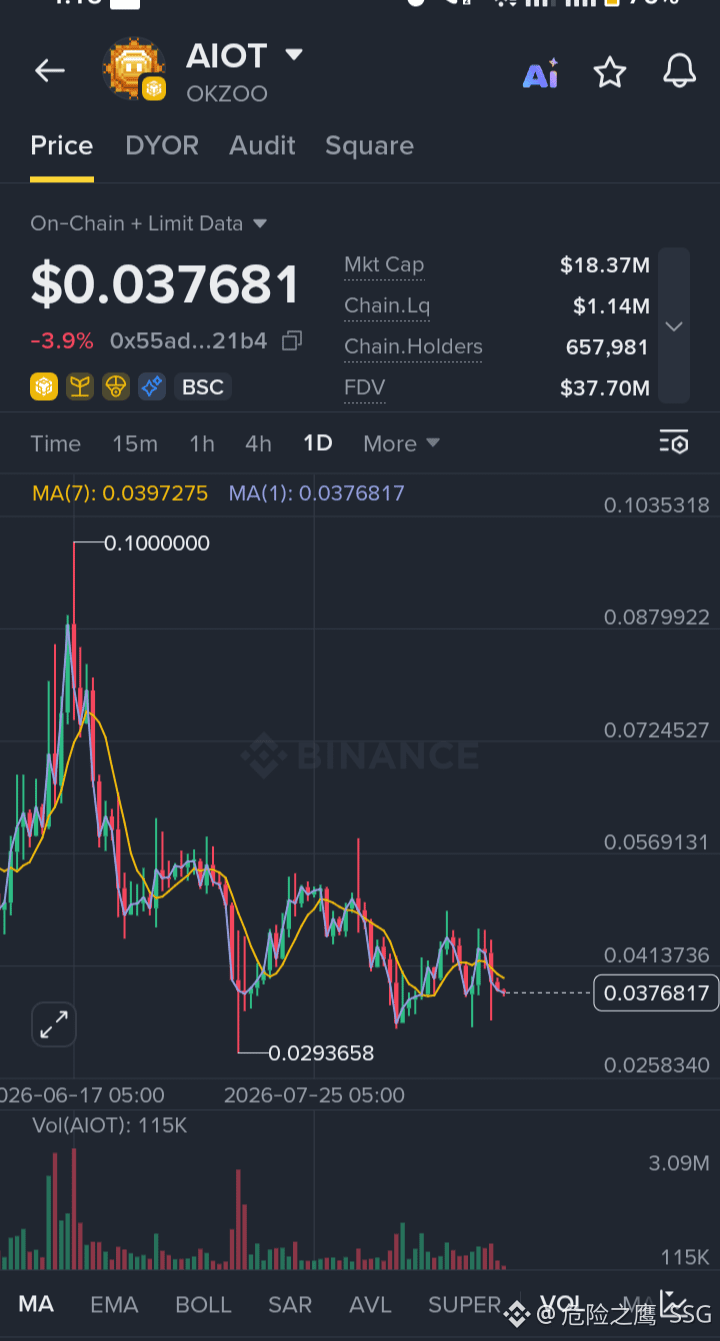
$AIOT is sitting near the lower part of its recent 1D range — the chart is worth watching closely.
$AIOT — ⚪ WATCH SETUP
Current Price: $0.037681
Timeframe: 1D
24H Change: -3.9%
Trade Plan:
Entry: Not provided
SL: Not provided
TP1: Not provided
TP2: Not provided
TP3: Not provided
Why this chart is interesting:
• On the 1D timeframe, AIOT is trading around $0.037681, while the displayed MA(7) is $0.0397275.
• Price is currently below the MA(7), showing that short-term momentum on this timeframe is weaker than the recent average.
• The chart shows a previous low around $0.0293658 and a historical high around $0.1000000 within the displayed period.
• The current market data shows approximately $18.37M market cap, $1.14M chain liquidity, and 657,981 holders.
Entry Approach:
No entry zone or breakout level was provided in the screenshot, so I would not invent one. The safer approach is to wait for a clearly defined setup or confirmation before assigning a LONG or SHORT trade.
Risk/Reward: Cannot be calculated because Entry, SL and TP levels are not provided.
Confidence: Not enough data for a reliable percentage.
The important point here is simple: AIOT is below its displayed MA(7), while the chart remains close to the lower portion of its recent trading range. The next confirmed move matters more than guessing the direction early.
Would you wait for a confirmed move above the MA(7), or watch for further weakness first?
Click here to Trade 👇️
$AIO
$AIOT — ⚪ WATCH SETUP
Current Price: $0.037681
Timeframe: 1D
24H Change: -3.9%
Trade Plan:
Entry: Not provided
SL: Not provided
TP1: Not provided
TP2: Not provided
TP3: Not provided
Why this chart is interesting:
• On the 1D timeframe, AIOT is trading around $0.037681, while the displayed MA(7) is $0.0397275.
• Price is currently below the MA(7), showing that short-term momentum on this timeframe is weaker than the recent average.
• The chart shows a previous low around $0.0293658 and a historical high around $0.1000000 within the displayed period.
• The current market data shows approximately $18.37M market cap, $1.14M chain liquidity, and 657,981 holders.
Entry Approach:
No entry zone or breakout level was provided in the screenshot, so I would not invent one. The safer approach is to wait for a clearly defined setup or confirmation before assigning a LONG or SHORT trade.
Risk/Reward: Cannot be calculated because Entry, SL and TP levels are not provided.
Confidence: Not enough data for a reliable percentage.
The important point here is simple: AIOT is below its displayed MA(7), while the chart remains close to the lower portion of its recent trading range. The next confirmed move matters more than guessing the direction early.
Would you wait for a confirmed move above the MA(7), or watch for further weakness first?
Click here to Trade 👇️
$AIO