$BTC
📉 Current Market Context
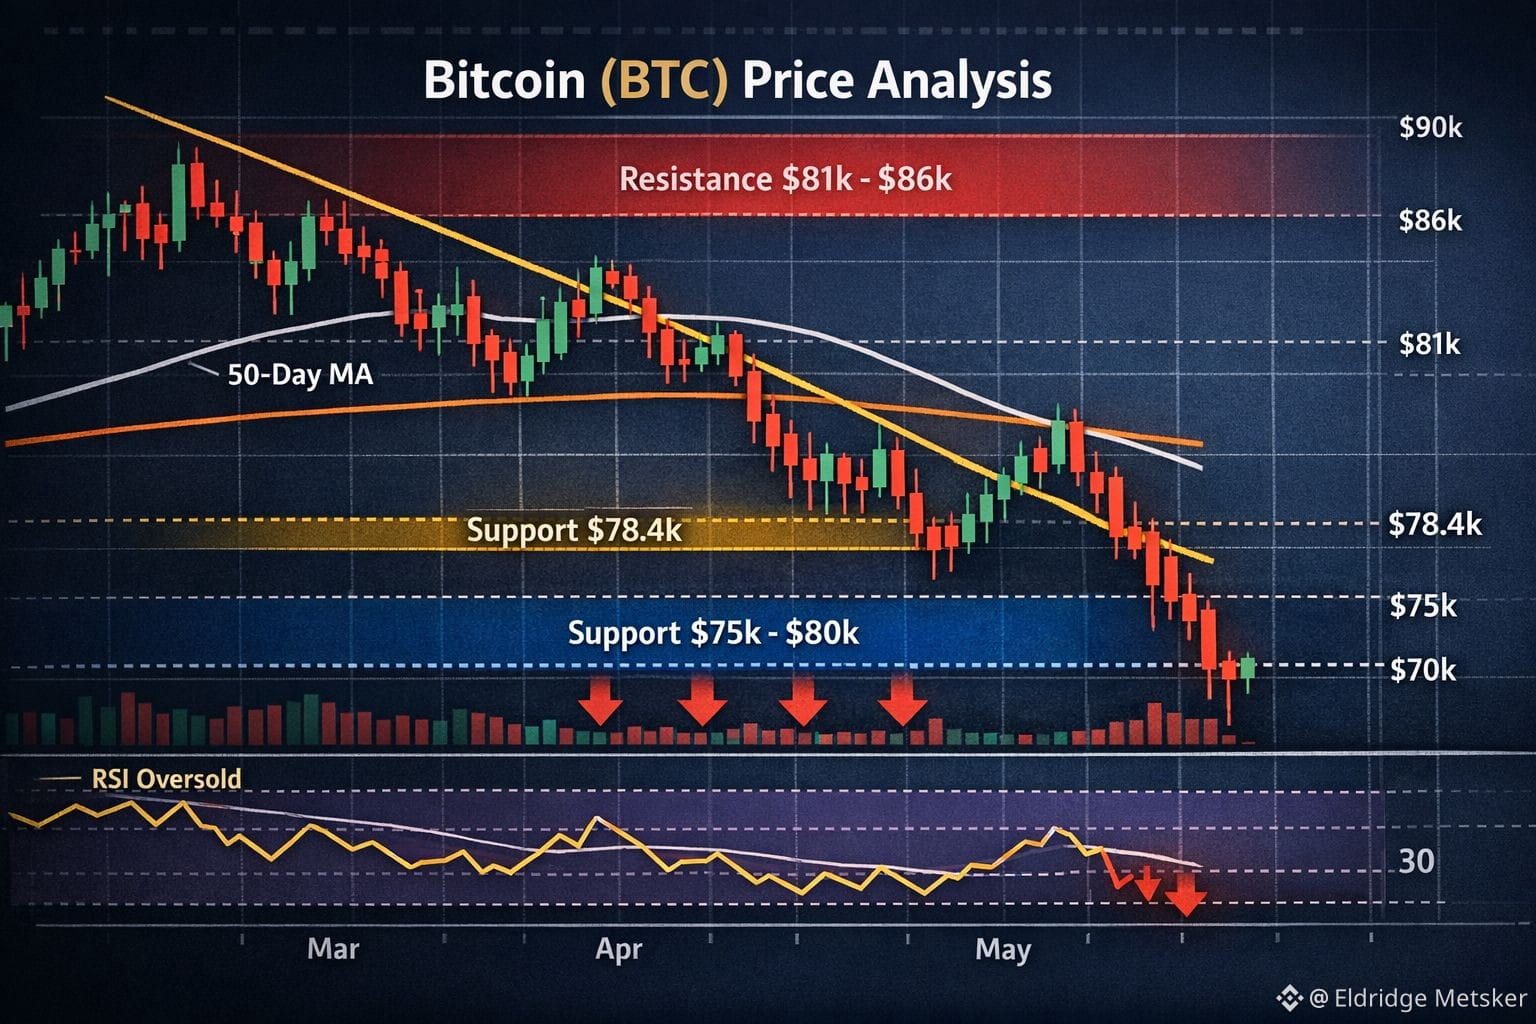
Bitcoin has been falling sharply recently, trading around ~$77k — near its lowest levels in months — after breaking below previous key support zones on the daily candle chart. This downturn has been tied to macro uncertainty (e.g., Fed leadership changes and tightening liquidity) and broad risk-asset sell-offs. News sentiment points to continued selling pressure and liquidity concerns weighing on BTC.
🕯️ Candlestick Chart Structure (Daily/Weekly)
Bearish candle patterns dominate recently, with consecutive red closes indicating momentum to the downside.
Lower highs and lower lows on daily/weekly timeframes signal a classic downtrend, with breakdowns below key candle supports accelerating selling.
Recent large bearish candles often close near intraday lows, showing selling pressure outweighs buying interest.
📊 Support & Resistance Levels
Based on technical sources:
Support zones: Near $78.4k and lower around $75k–$80k, where BTC may find short-term buyers.
Resistance zones: Overhead resistance sits roughly $81k–$86k and stronger above. Unless candles close above these zones with volume, trend remains weak.
📈 Technical Indicators (Candle Chart Signals)
RSI & Oscillators: Markets often show oversold conditions on shorter timeframes (e.g., daily/4H), hinting at possible relief bounces — but not necessarily trend reversal.
Moving averages: Price is below key SMAs/EMAs on larger timeframes, cementing the bearish structure.
🧠 Interpretation
Bearish trend persists as long as daily candles consistently close below major resistance and moving averages.
Oversold conditions may produce short-term relief bounces, but without breaking key resistances and shifting candle patterns to bullish formations (e.g., bullish engulfing, higher lows), the broader downtrend remains intact.
🟡 Summary
Trend: Bearish — downtrend confirmed by candle patterns and lower price structure.
Key candle levels to watch: Support ~ $75k–$80k, resistance ~ $81k–$86k.
#MarketCorrection