$BTC (Bitcoin) – Short Latest Analysis
24 August 2026
Current Price: ≈ $77,400–77,500
24h: Mildly lower / flat after strong week
7d: +≈20–23% (strongest weekly performance in months)
Market Cap: ~$1.5T+
Analysis Chart (Daily – BINANCE:BTCUSDT)
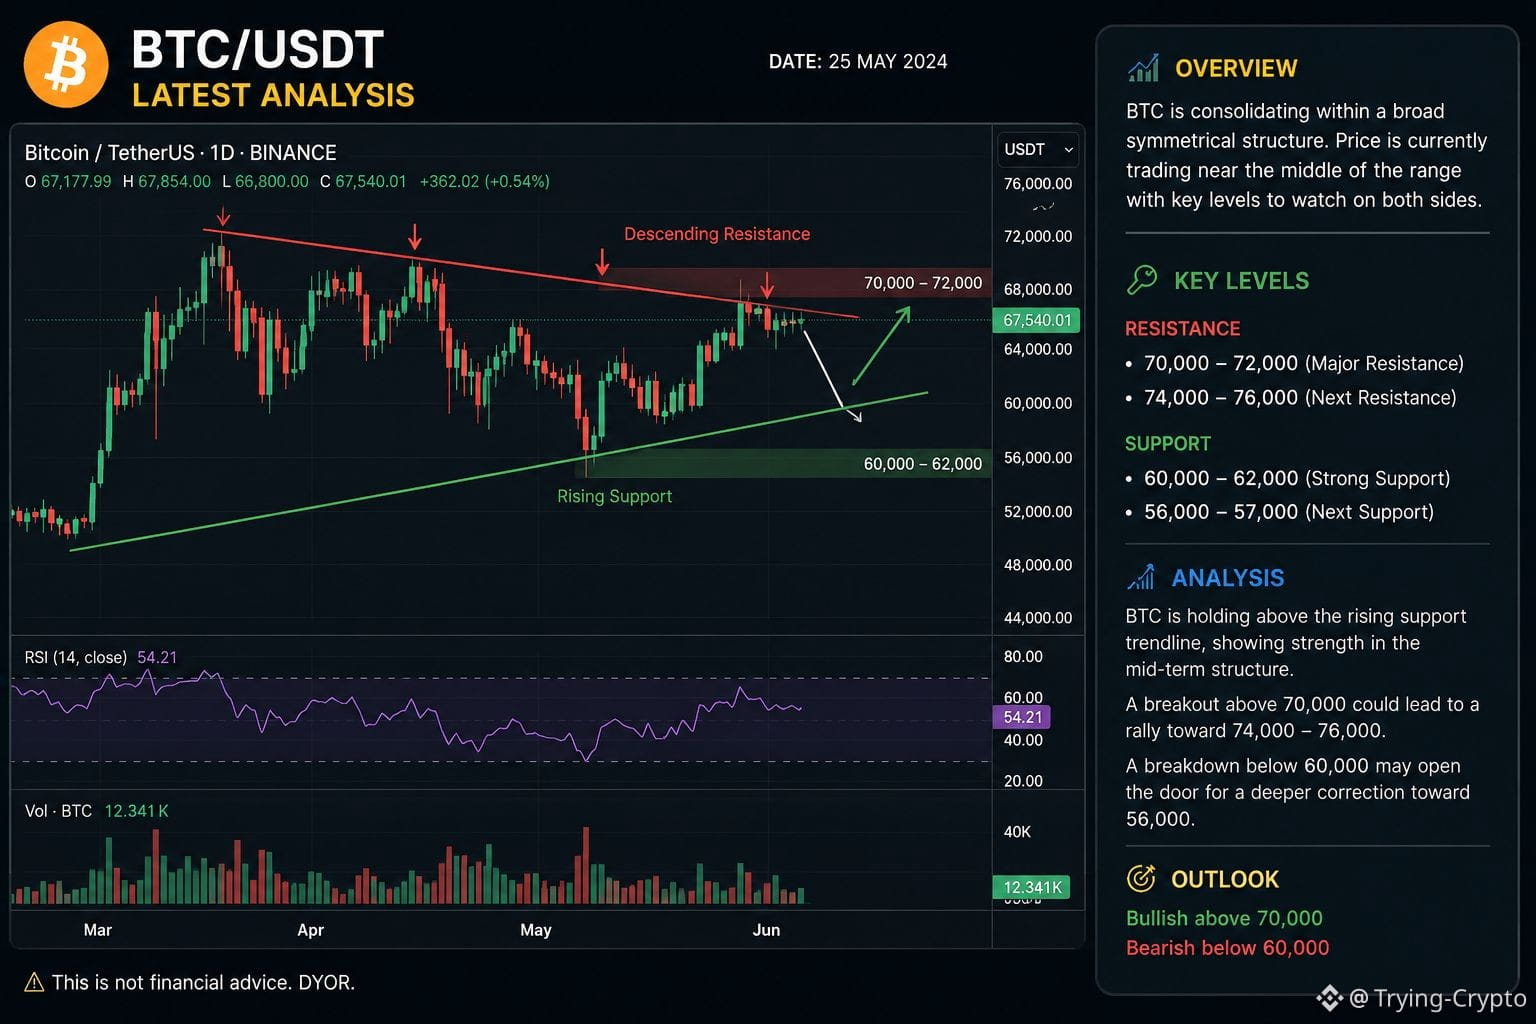
The daily chart shows $BTC recovering from the June–July lows near $58k–$62k. After a period of consolidation, a sharp multi-day rally from mid-August pushed price from the mid-$60ks through $70k and briefly toward $79k before settling in the mid-to-high $77k area. Volume expanded on the upside move.
Key Points
Drivers: Strong weekly rally driven by U.S. Treasury buyback announcements (liquidity support), improving institutional ETF flows (strongest weekly inflows of 2026 in some reports), and broader risk-on sentiment. Technicals: Price broke above recent resistance and is now consolidating after the rapid advance. RSI has been elevated (overbought on shorter timeframes).
Resistance: $79,000–$80,000 zone Support: $75,000–$76,000, then $72,000–$73,000
Structure: Higher lows forming after the summer bottom; short-term bull flag / consolidation possible after the strong leg up.
Short Outlook
Bullish bias remains while price holds above the $75k area. The market is digesting the ~20%+ weekly gain. A clean break and hold above $79k–$80k would open the path toward higher targets ($84k+). Failure to hold key supports could see a deeper pullback toward the mid-$70ks or lower.
Not financial advice. Cryptocurrency is highly volatile — always DYOR.
#BTC🔥🔥🔥🔥🔥 #btc70k #BuyTheDip
24 August 2026
Current Price: ≈ $77,400–77,500
24h: Mildly lower / flat after strong week
7d: +≈20–23% (strongest weekly performance in months)
Market Cap: ~$1.5T+
Analysis Chart (Daily – BINANCE:BTCUSDT)
The daily chart shows $BTC recovering from the June–July lows near $58k–$62k. After a period of consolidation, a sharp multi-day rally from mid-August pushed price from the mid-$60ks through $70k and briefly toward $79k before settling in the mid-to-high $77k area. Volume expanded on the upside move.
Key Points
Drivers: Strong weekly rally driven by U.S. Treasury buyback announcements (liquidity support), improving institutional ETF flows (strongest weekly inflows of 2026 in some reports), and broader risk-on sentiment. Technicals: Price broke above recent resistance and is now consolidating after the rapid advance. RSI has been elevated (overbought on shorter timeframes).
Resistance: $79,000–$80,000 zone Support: $75,000–$76,000, then $72,000–$73,000
Structure: Higher lows forming after the summer bottom; short-term bull flag / consolidation possible after the strong leg up.
Short Outlook
Bullish bias remains while price holds above the $75k area. The market is digesting the ~20%+ weekly gain. A clean break and hold above $79k–$80k would open the path toward higher targets ($84k+). Failure to hold key supports could see a deeper pullback toward the mid-$70ks or lower.
Not financial advice. Cryptocurrency is highly volatile — always DYOR.
#BTC🔥🔥🔥🔥🔥 #btc70k #BuyTheDip