

Guys A large token unlock event has triggered selling pressure, pushing price toward a level that previously stopped the fall.
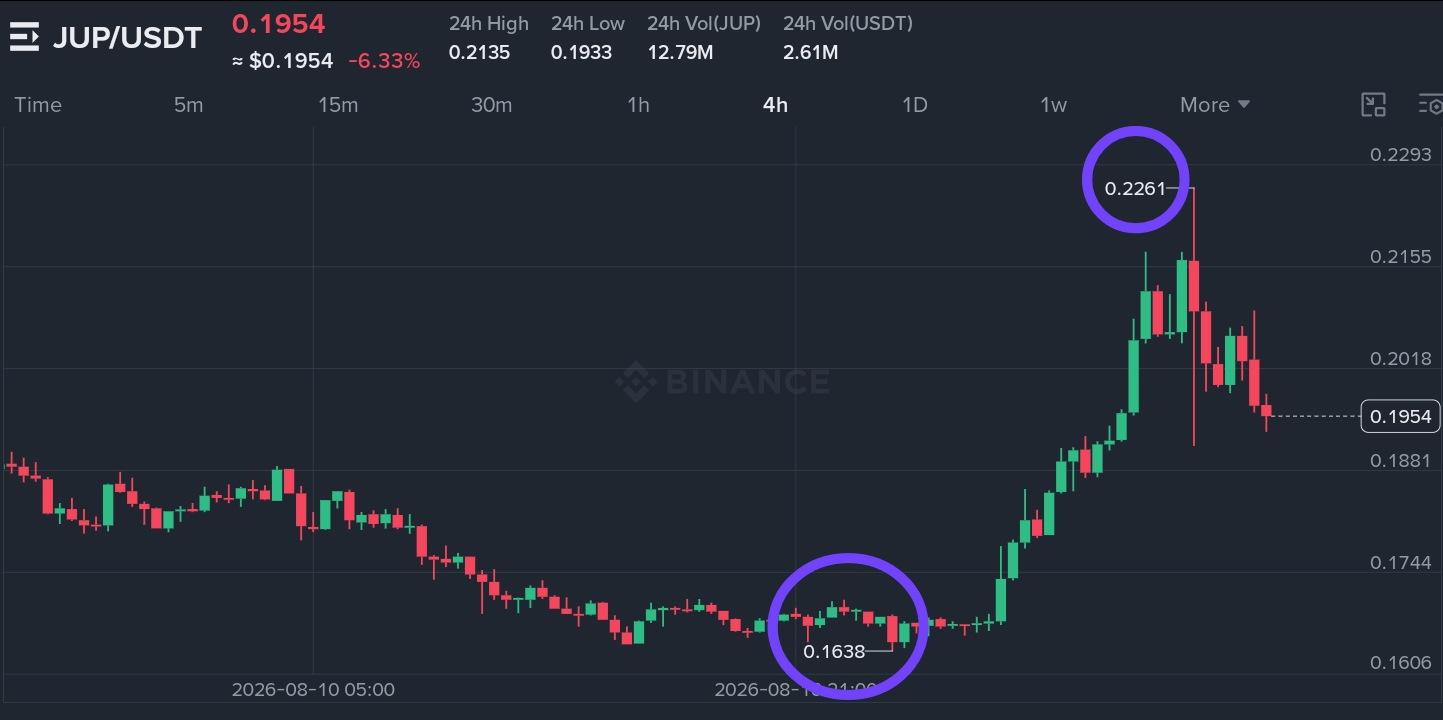
$JUP has been in a steady decline from the 0.2293 high, breaking through 0.2261 and 0.2155 before touching 0.1933. The 4-hour chart shows lower highs forming, confirming that sellers remain in control. Currently, price is trading near 0.1954, hovering just above the recent low. The 24-hour volume of 12.79M USDT shows active participation, but the selling pressure is clearly dominant.
Recent on-chain data reveals that a token unlock event released approximately 210 million JUP into circulation. This has added extra supply to the market, weighing on price. While Solana's ecosystem remains strong and JUP holds its position as a leading DEX aggregator, the immediate impact of the unlock has created a supply-demand imbalance. Traders are now watching how this excess supply gets absorbed.
Support: 0.1933
Major support: 0.1881
Resistance: 0.2018
Major resistance: 0.2155
Watch Zone: The 0.1933 to 0.1954 area could act as a reaction point if buyers step in and hold above 0.1933 on a 4-hour close.
Next Target: If price climbs above 0.2018 and holds, the next resistance at 0.2155 becomes the focus.
Invalidation: A sustained 4-hour close below 0.1933 would break the support thesis.

The key lesson here is understanding how events like token unlocks create temporary supply pressure. When large amounts of tokens enter the market, price often needs time to absorb that supply. This is why support levels matter—they show where buyers are willing to step in. A clean hold at 0.1933 would suggest that demand is strong enough to absorb the new supply, while a break below signals that sellers still dominate.
If $JUP holds above 0.1933 and reclaims 0.2018, the next resistance near 0.2155 could be tested, potentially opening the door for a recovery move. A decisive break above 0.2155 would suggest a shift in momentum.
If 0.1933 breaks with sustained selling pressure, the structure would weaken further, and price could drop to 0.1881 or lower. Repeated rejection at 0.2018 would confirm that sellers remain active at that level.
A sustained 4-hour close below 0.1933 would invalidate the current support idea. Until then, the zone between 0.1933 and 0.2018 is the key area to watch. A clean close above 0.2018 would show strength, while a close below 0.1933 would point to more downside.
Are you watching this support zone for a bounce, or do you expect more downside ahead?
Educational only. Not financial advice. Manage risk.