
Exactly — you want a chart explanation, not a signal format. The explanation should focus on the candle structure and what the pattern is suggesting.
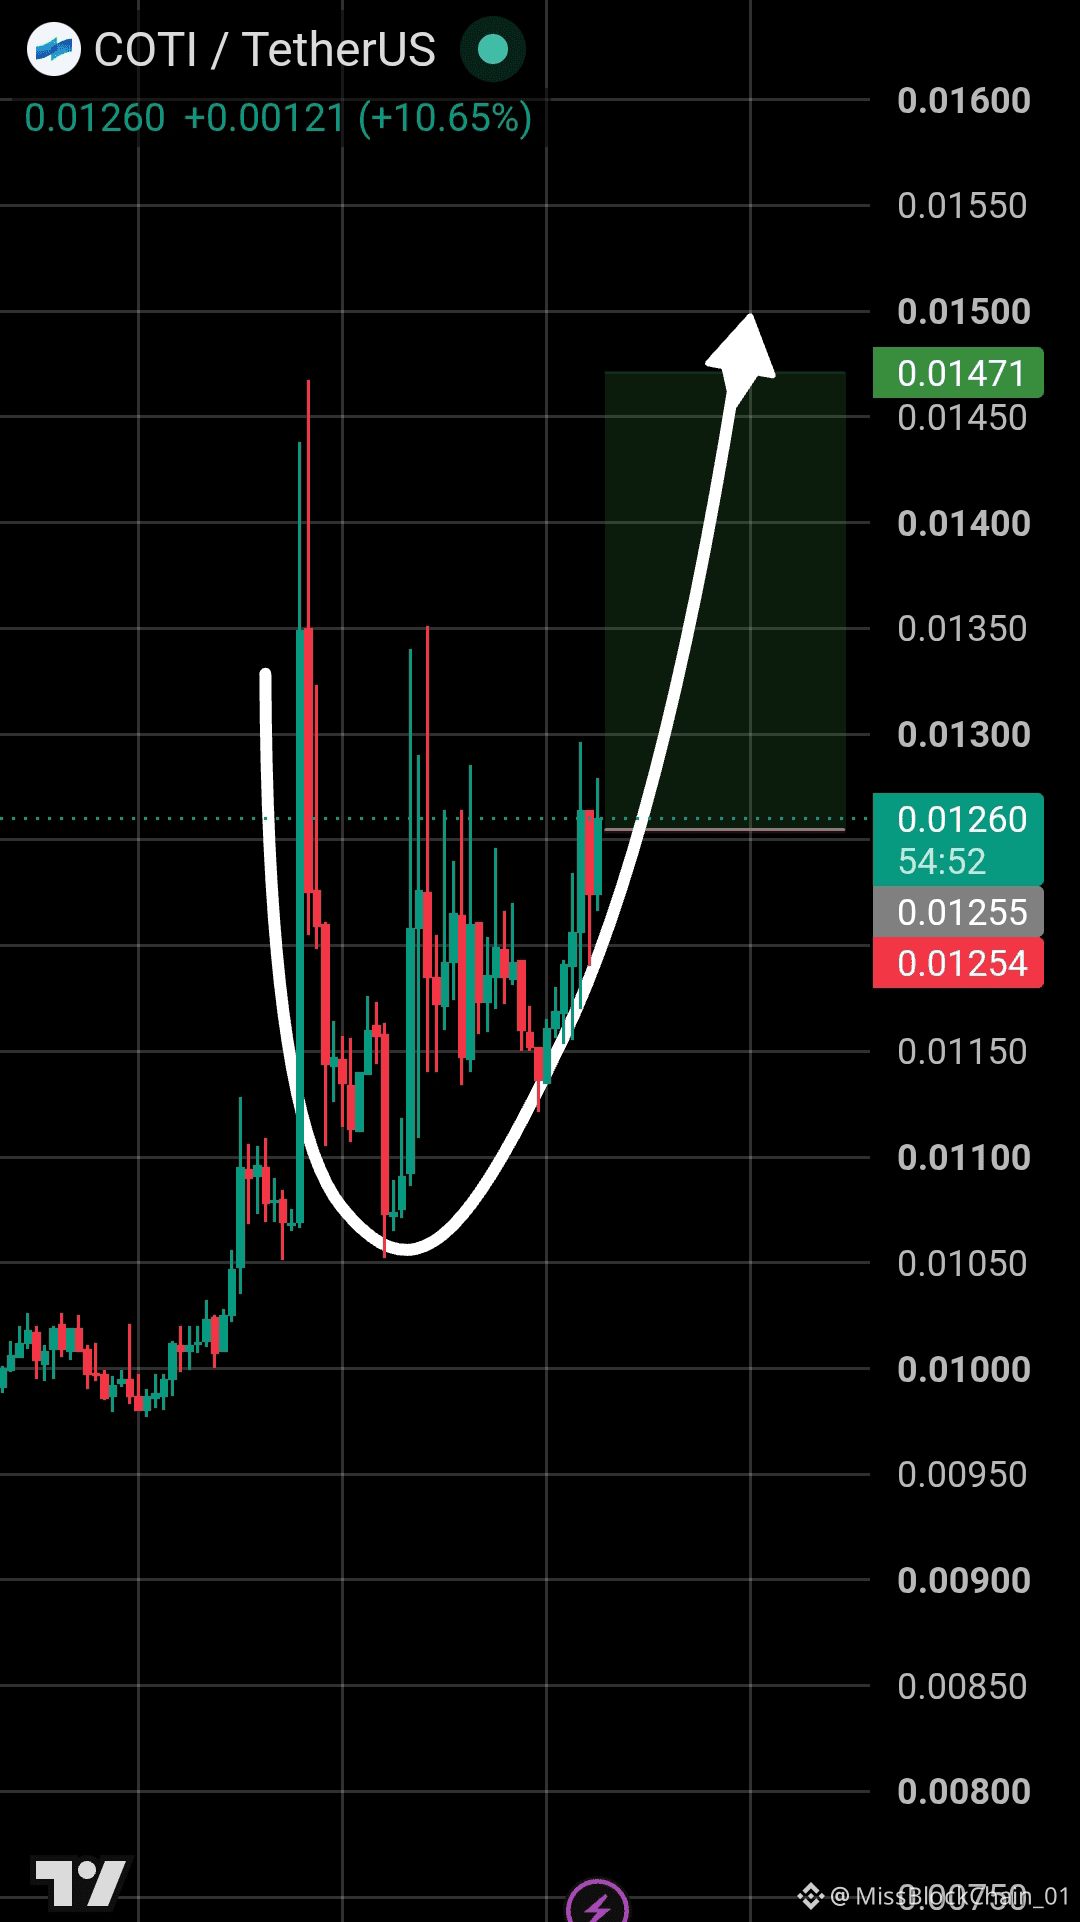
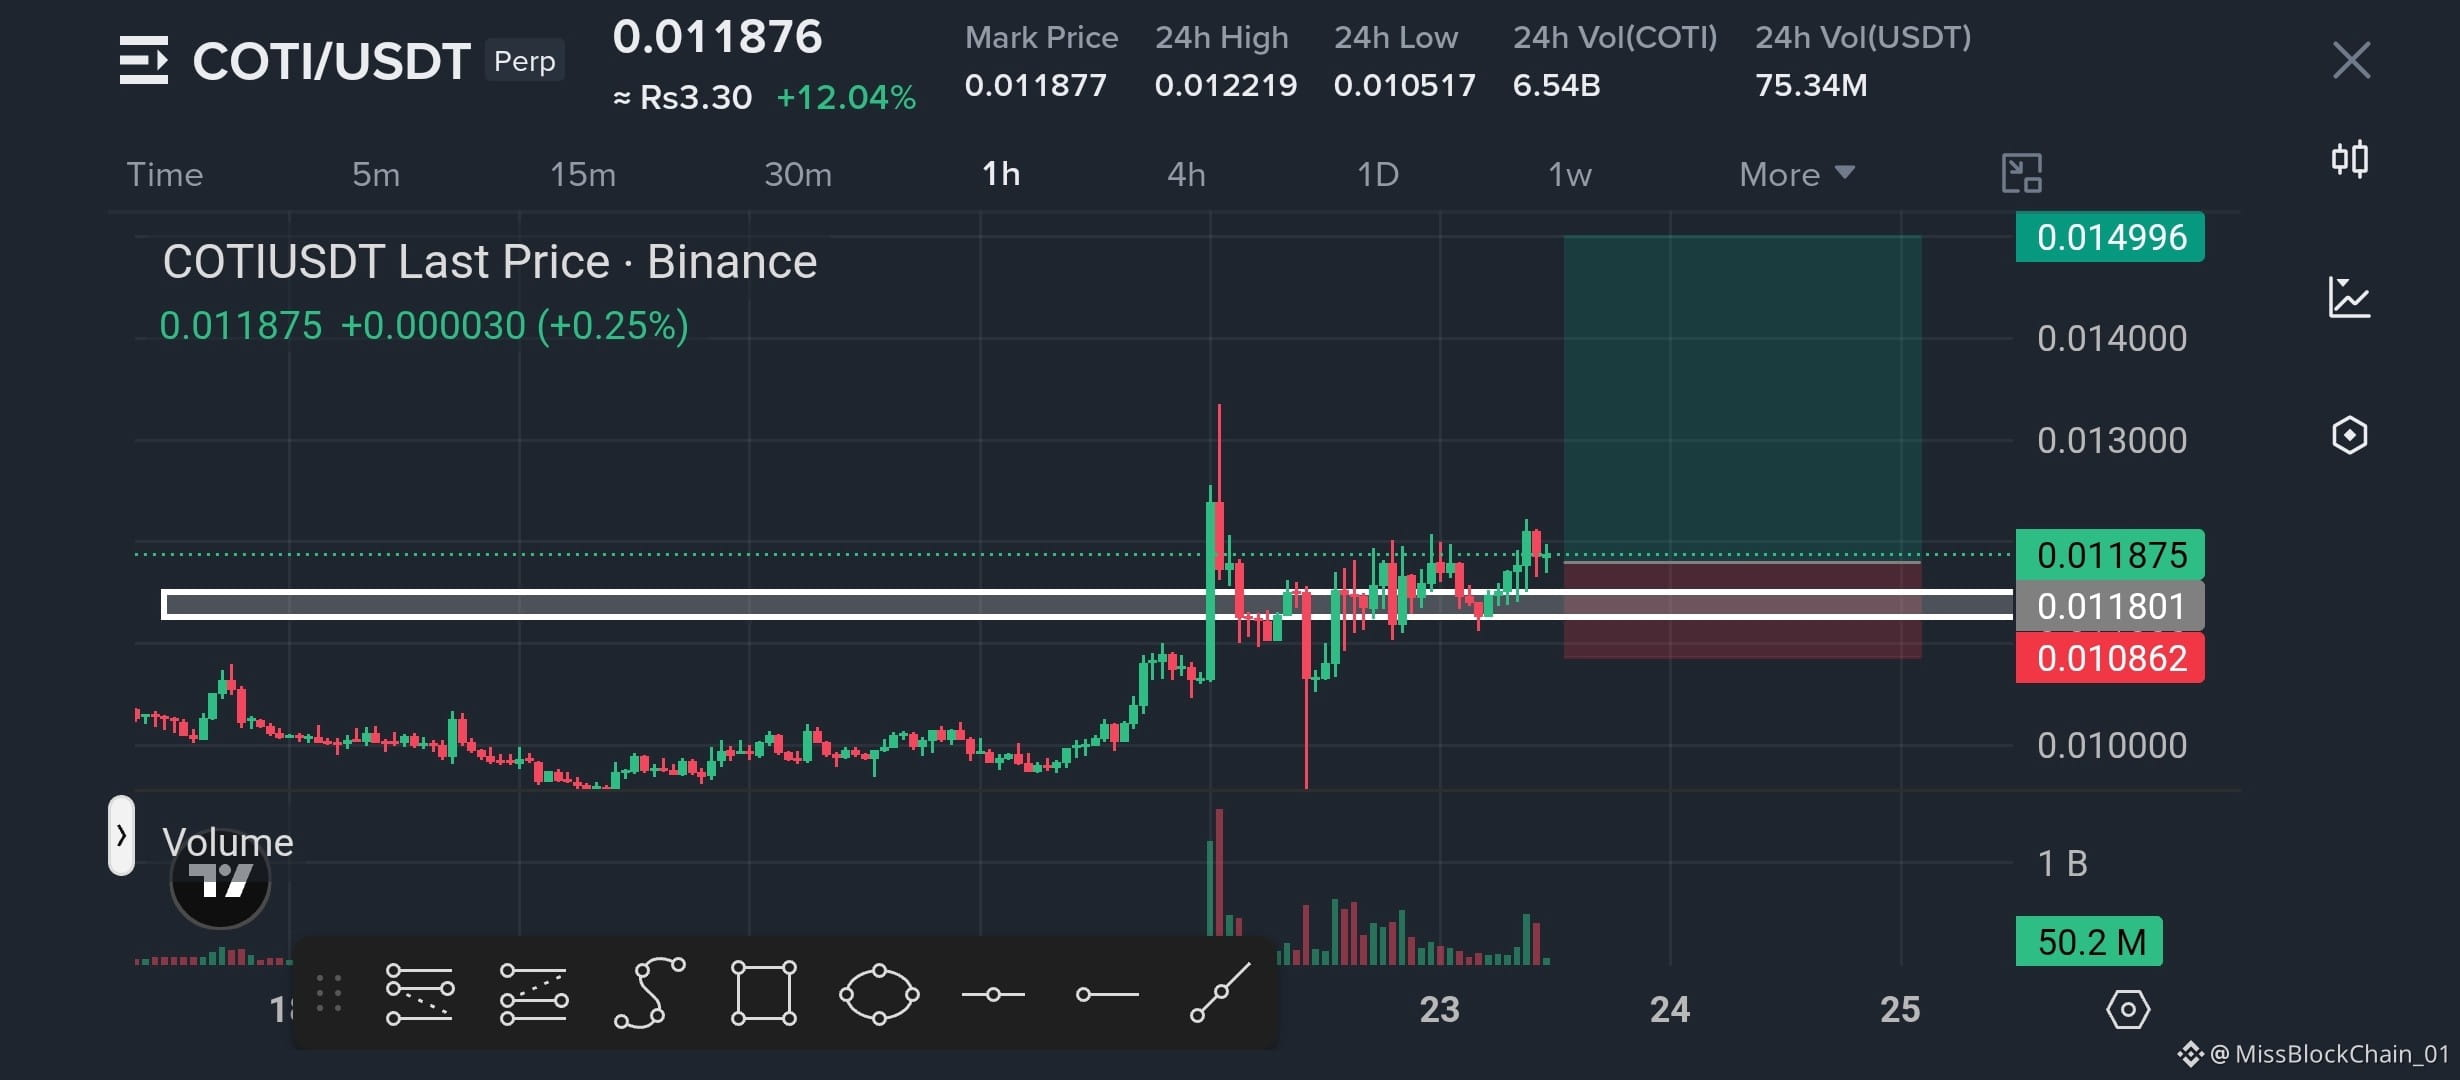
On the 1H chart, $COTI has spent several candles consolidating after the previous sharp move, with price repeatedly holding the lower area and forming a rounded/single-bottom type structure. Now candles are pushing back above the recent consolidation zone, showing that buyers are gradually taking control.
If this structure continues to hold, $COTI can turn bullish and move toward the 0.0135–0.0145 area first, with 0.0150 as the next major upside zone. The bullish move would be expected to develop over the next several 1H candles, provided the current support continues to hold.
On the 1H chart, $COTI has spent several candles consolidating after the previous sharp move, with price repeatedly holding the lower area and forming a rounded/single-bottom type structure. Now candles are pushing back above the recent consolidation zone, showing that buyers are gradually taking control.
If this structure continues to hold, $COTI can turn bullish and move toward the 0.0135–0.0145 area first, with 0.0150 as the next major upside zone. The bullish move would be expected to develop over the next several 1H candles, provided the current support continues to hold.