$BNB
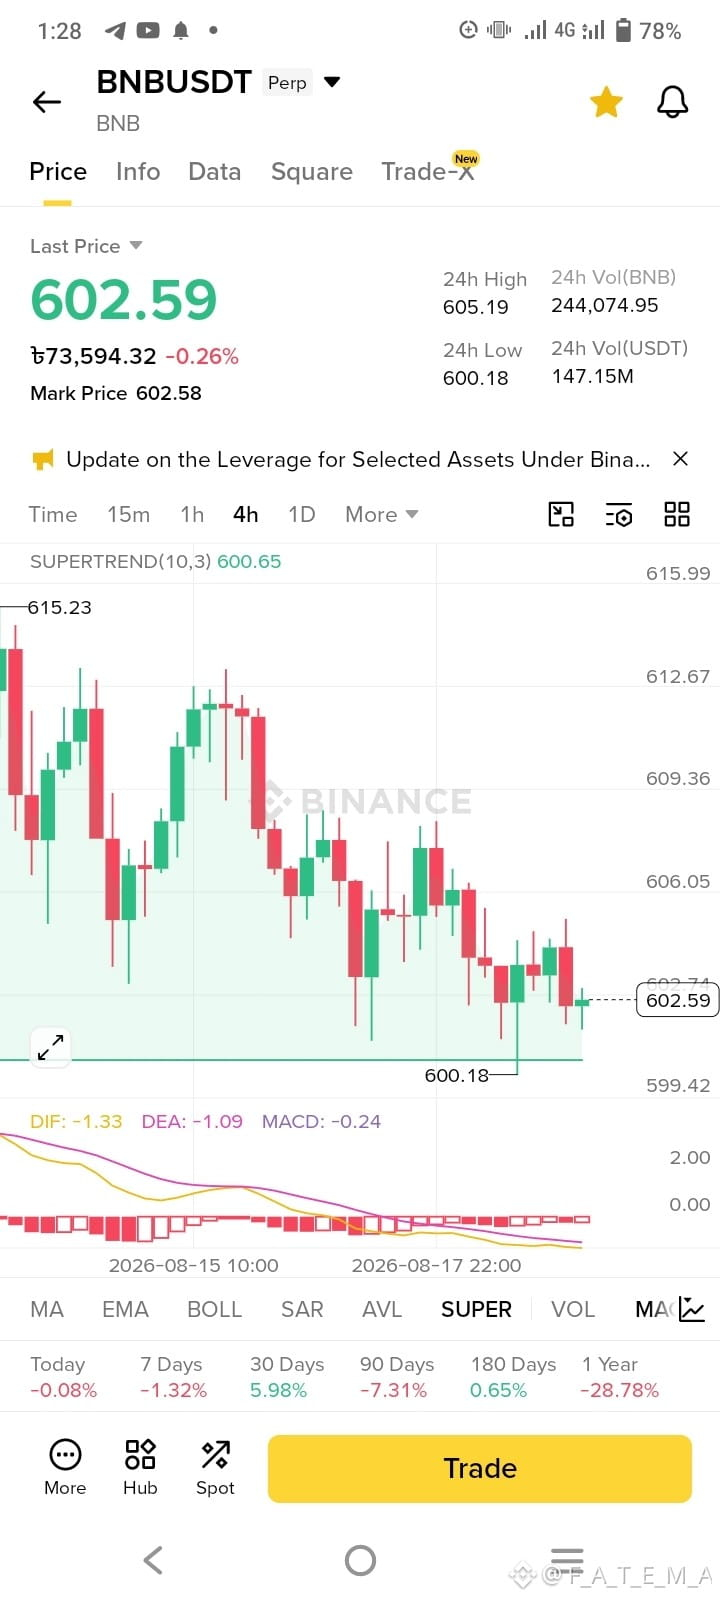
Based on the current 4-hour **BNBUSDT** chart, whether BNB hits **$610** depends on how it handles immediate overhead resistance and momentum.
Key Technical Observations from the Chart:
* **Current Price:** **602.59 USDT**, hovering tightly near the lower-to-middle section of its recent local range.
* **Immediate Resistance:** The price faces a near-term ceiling around the **$610 to $615** zone.
Previous attempts faced selling pressure around these higher levels, and the broader 4h structure has been in a minor corrective phase after failing to hold higher highs near $615–$617.
* **SuperTrend & Moving Averages:** The SuperTrend line is sitting just underneath at **600.65**, acting as immediate key support.
As long as BNB stays above this line, the baseline trend isn't completely broken, but momentum indicators like the MACD are currently leaning slightly flat-to-negative (MACD at -0.24, with DIF below DEA).
Will it go to $610?
* **The Case for Reaching $610:** $610 is a very modest move (less than a 1.5% increase from current levels). If buyers manage to step in at the current support floor ($600–$602) and generate a push of volume, touching $610 is entirely realistic as a routine retest of local resistance.
* **The Risk:** If buying volume stays weak and it slips below the $600 support and the SuperTrend level, it risks a deeper slide toward the $585–$587 demand zone before any meaningful recovery toward $610 can happen.
Watch the reaction closely if it approaches the 605–610 corridor; a breakout with rising volume is needed to confirm a clear path to $610 and above.
#FutureTarding
Based on the current 4-hour **BNBUSDT** chart, whether BNB hits **$610** depends on how it handles immediate overhead resistance and momentum.
Key Technical Observations from the Chart:
* **Current Price:** **602.59 USDT**, hovering tightly near the lower-to-middle section of its recent local range.
* **Immediate Resistance:** The price faces a near-term ceiling around the **$610 to $615** zone.
Previous attempts faced selling pressure around these higher levels, and the broader 4h structure has been in a minor corrective phase after failing to hold higher highs near $615–$617.
* **SuperTrend & Moving Averages:** The SuperTrend line is sitting just underneath at **600.65**, acting as immediate key support.
As long as BNB stays above this line, the baseline trend isn't completely broken, but momentum indicators like the MACD are currently leaning slightly flat-to-negative (MACD at -0.24, with DIF below DEA).
Will it go to $610?
* **The Case for Reaching $610:** $610 is a very modest move (less than a 1.5% increase from current levels). If buyers manage to step in at the current support floor ($600–$602) and generate a push of volume, touching $610 is entirely realistic as a routine retest of local resistance.
* **The Risk:** If buying volume stays weak and it slips below the $600 support and the SuperTrend level, it risks a deeper slide toward the $585–$587 demand zone before any meaningful recovery toward $610 can happen.
Watch the reaction closely if it approaches the 605–610 corridor; a breakout with rising volume is needed to confirm a clear path to $610 and above.
#FutureTarding