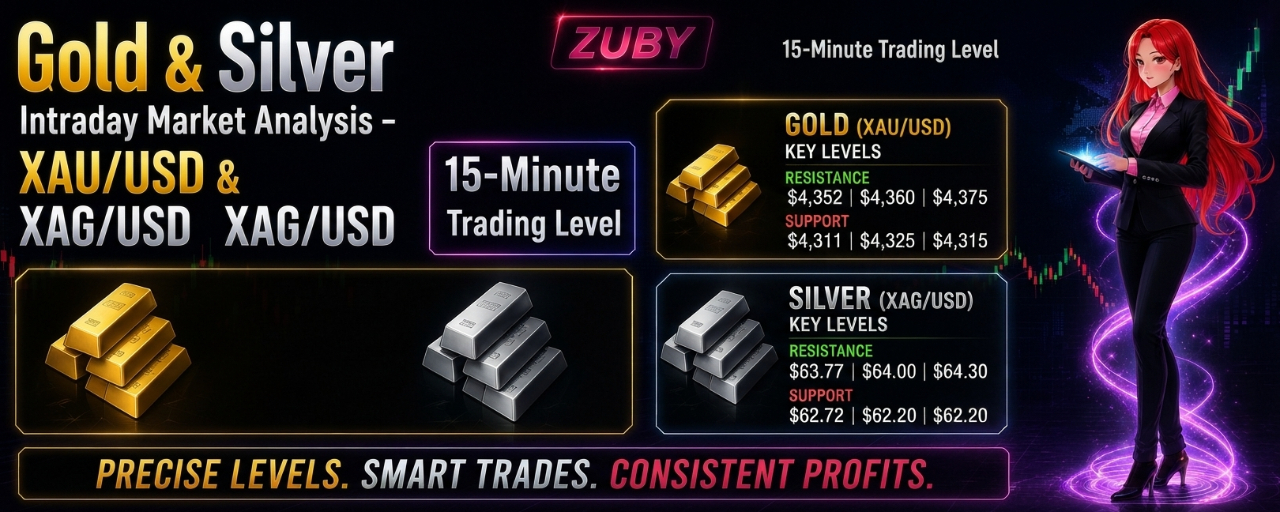


金&銀 日中マーケット分析 — 2026年8月19日
マーケット概況:アジア時間の取引は始まり、両銘柄とも昨日の急な売りからの回復を試みています。
✧ 金は1オンス当たり約4,343ドル、銀は約63.05ドルです。
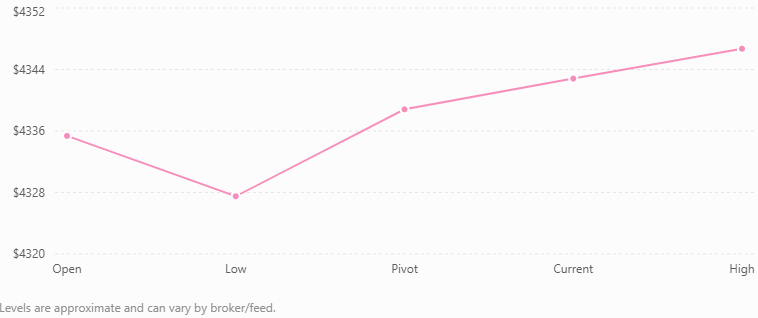
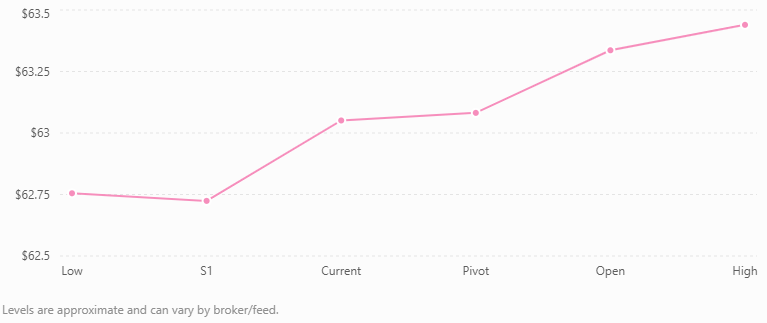
✧ 金は本日約4,335ドル近辺で寄り付き、これまでおよそ4,327.5〜4,346.7ドルで推移しています。銀は約63.34ドル近辺で寄り付き、これまでおよそ62.75〜63.44ドルで推移しています。
✧ 昨日は重要な日でした。金は約1.6〜1.9%下落し、銀はほぼ3〜4%下落しました。世界の債券利回りが急騰したためです。
✧ 米国の30年国債利回りが一時、2007年以来の最高水準に達し、利回りのつかない金属にとって大きな逆風となりました。
🥇 XAU/USD — ゴールド
✧ 現在の水準:~$4,340〜$4,343
✧ 今日のオープン:~$4,335
✧ 今日の高値:~$4,346.7
✧ 今日の安値:~$4,327.5
日中のピボット計算
ピボット:$4,338.8
R1:$4,345.4
R2:$4,352.3
S1:$4,331.5
S2:$4,325.4
差し当たりの主戦場は $4,338〜$4,346 です。
強気シナリオ:
✧ 15分足のローソクが $4,346〜$4,347 を終値で上回り、その後に成功したリテストが続けば、アジア時間の回復が本物の反転を狙う動きになっていることを示唆します。
✧ 目標はおよそ $4,352 → $4,360 → $4,375/$4,390 へ。
弱気シナリオ:
✧ $4,345〜$4,350付近で失速し、その後15分足の終値が $4,331 を下回ると、売り手が再び主導権を握ります。
✧ 次の到達エリアは $4,325 → $4,315 → $4,300 です。
✧ デイトレーダーにとって重要なのは、最初の動きを追いかけないことです。昨日の大きな下落は、(下落の継続)とショートカバーの戻りの両方が起こり得ることを意味します。
🥈 XAG/USD — シルバー
✧ 現在の水準:~$63.05
✧ 今日のオープン:~$63.34
✧ 今日の高値:~$63.44
✧ 今日の安値:~$62.75
日中のピボット計算
ピボット:$63.08
R1:$63.41
R2:$63.77
S1:$62.72
S2:$62.40
✧ シルバーは現在、計算上のピボットのほぼ真上に位置しており、$63.08が当面の方向性を示すラインです。
強気:15分足の終値が $63.40〜$63.45 を上回る → $63.77 → $64.00 → $64.30。
弱気:15分足の終値が $62.72 を下回る → $62.40 → $62.20 → 場合によっては $61.80。
✧ シルバーは金よりもかなりボラティリティが高いので、アジア時間のレンジ周辺での誤ったブレイクアウトに特に注意が必要です。
📊 今日の15分足トレーディング・マップ
19 Aug 2026 — ゴールドの日中レンジ・マップ
✧ 今日の公表されたオープン、最高値、最安値、現在価格から算出したXAU/USDの当日水準です。これは15分足の再構築チャートではなく、レベルマップです。
19 Aug 2026 — シルバーの日中レンジ・マップ
✧ 今日の公表されたオープン、最高値、最安値、現在価格から算出したXAG/USDの当日水準です。これは15分足の再構築チャートではなく、レベルマップです。
🌎 今日のファンダメンタル要因
1. FRB議事録が最大の材料
✧ 市場は米連邦準備制度(FRB)の最新の議事録を待っています。
✧ 直近の雇用とインフレの軟化データにより、直近の利上げ観測が弱まりました。これは金にとって追い風です。
✧ ただし債券市場は逆のシグナルを出しています。長期の期間(デュレーション)に対応する利回りが依然として非常に高いままです。
これにより、金市場は両方向(セクション)で展開することになります。
✧ ハト派寄りのFRB解釈 → USD/利回りの低下 → 金/シルバーの上昇
✧ ハト派(タカ派寄り)解釈 → USD/利回りの上昇 → 金/シルバーの下落
ここ数分の間で、ボラティリティ(変動性)が大幅に増えることを見込んでください。
2. 財務省利回り(米国債利回り)が最大の弱気リスク
✧ 昨日、米国の30年国債利回りが約5.34%に到達したことが、地政学リスクがあっても金が苦戦した大きな理由です。
✧ 利回りが高いほど、利息を生まない資産を保有する機会費用が増えます。
3. 財務省(米国債)利回り
✧ ドルは現在、積極的にトレンドしているというより“レンジ内”に比較的収まっています。ロイターは8月18日にDXYが約99.63付近だと報じました。
✧ したがって、今日の最もきれいな金のシグナルは次の通りです:
✧ 金のブレイクアウト + DXYの弱さ + 米国債利回りの下落 = より強い強気の確証。
一方で:
✧ 金のリジェクション + DXYの強さ + 利回り上昇 = 高品質な弱気の確証
4. 地政学リスク
✧ 継続している米国—イラン/ホルムズ海峡をめぐる状況は、安全資産需要の材料として残っています。しかしこの市場の通常と違う点は、地政学的なストレスが同時に原油とインフレ期待も押し上げ、それが利回りをより高くし、結果として金に不利に働き得ることです。
🎯 最適なデイトレード・セットアップ
🟢 金の買い(ロング)—ブレイクアウトセットアップ
トリガー:15分足の終値が $4,347 を上回る
エントリー:リテスト後の $4,347〜$4,350
SL:$4,338
TP1:$4,352
TP2:$4,360
TP3:$4,375+
✧ $4,347をヒゲで超えたからといって、ただちにエントリーしないでください。15分足の終値 + リテストを待ちましょう。
🔴 金の売り(ショート)—リジェクション(拒否)セットアップ
✧ もし価格が $4,345〜$4,352 に到達して、強い15分足のリジェクションを生み出すなら:
エントリー:確認後におおよそ $4,342〜$4,348
SL:$4,357
TP1:$4,332
TP2:$4,325
TP3:$4,315
$4,325の明確なブレイクは、弱気シナリオを大きく強めるでしょう。
🟢 シルバー買い(ロング)
✧ $63.45を上抜けた15分足の終値
目標:
$63.77 → $64.00 → $64.30
✧ $63.40〜$63.45のリテストがあり、それを維持できるなら、垂直に伸びる足を追いかけるより好ましいです。
🔴 シルバー売り(ショート)
✧ $62.72を下抜けた15分足の終値
目標:
$62.40 → $62.20 → $61.80
✧ 金が同時に $4,331 を失うなら、シルバーのショートは特に魅力的になります。
🔥 きょうの日中の見通し

金は、管理されたデイトレードにおいて現在はより“きれい”な銘柄です。シルバーは値動きのパーセンテージが大きい一方で、ボラティリティが高いため、誤ったブレイクアウトがより危険になります。
今日最も重要な水準は:
金(GOLD): $4,347 / $4,331
シルバー(SILVER): $63.45 / $62.72
✧ 上側の水準を上抜けたら、押し目(リテスト)での買いセットアップを狙ってください。下側の水準を下回ったら、戻り売り(リテストでの売り)セットアップを狙ってください。その間は待つのが望ましいです。
⚠️ リスク管理
✧ 今日の市場はFRBのコミュニケーションと、極めて高い米国債利回りの影響を受ける位置関係にあるため、過度なレバレッジは避けてください。
✧ 15分のヒゲだけでも、実際の方向性が出る前に、軽いストップに誘発されやすいです。
✧ 1つのセットアップあたり、取引資金の約0.5〜1%をリスクにするのは、取り逃した値動きを埋め合わせるためにサイズを増やすよりも、はるかに頑健です。
📌 要点:金は昨日の下落からは小幅に回復しましたが、まだ確定した強気の反転は示せていません。
✧ $4,345〜$4,350のゾーンが最初の本当のテストです。
✧ シルバーは$63.40〜$63.45を取り戻す必要があります。これらの水準を15分足でブレイクし、定着するまで、今日は上昇を無条件に決め打ちするよりもレンジ取引が最善です。
#XAUUSD #XAGUSDT社区热度不低 #TradingStrategyg #TechnicalAnalysis #ForexTrading